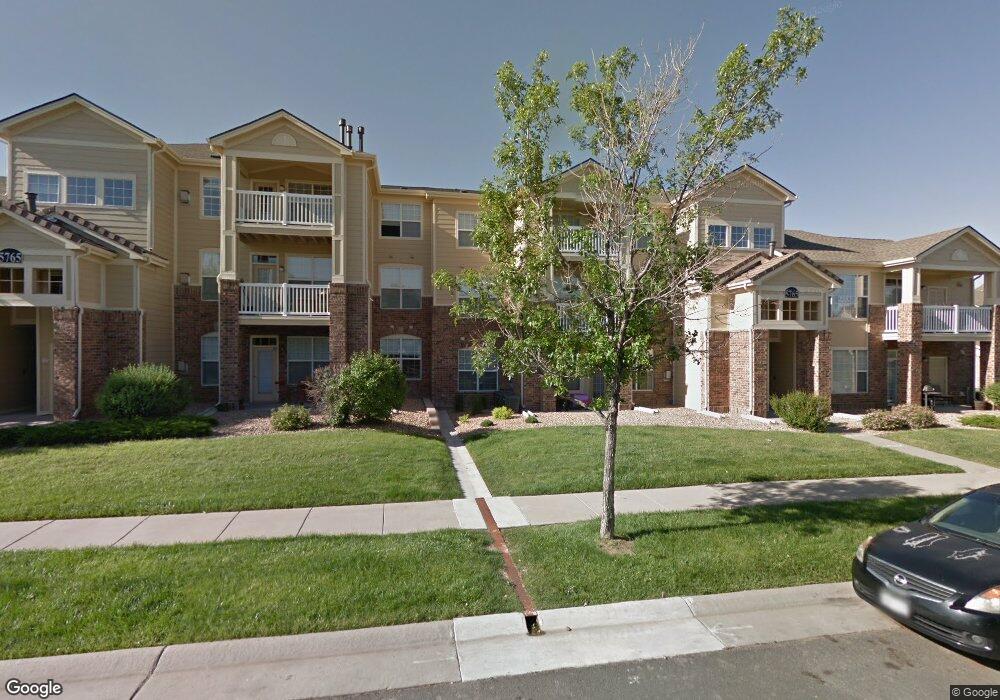
5765 N Genoa Way Unit 1305 Aurora, CO 80019
Estimated Value: $274,000 - $300,000
2
Beds
2
Baths
1,088
Sq Ft
$263/Sq Ft
Est. Value
About This Home
This home is located at 5765 N Genoa Way Unit 1305, Aurora, CO 80019 and is currently estimated at $286,452, approximately $263 per square foot. 5765 N Genoa Way Unit 1305 is a home located in Adams County with nearby schools including Vista Peak 9-12 Preparatory, High Point Academy, and Omar D Blair Charter School.
Ownership History
Date
Name
Owned For
Owner Type
Purchase Details
Closed on
Apr 15, 2013
Sold by
Quinlan Patrick J
Bought by
Quinlan Rebecca B
Current Estimated Value
Purchase Details
Closed on
Feb 23, 2013
Sold by
Quinlan Patrick J
Bought by
Quinlan Rebecca B
Purchase Details
Closed on
Apr 7, 2008
Sold by
Wilson Paul
Bought by
Suntrust Mortgage Inc
Purchase Details
Closed on
Feb 25, 2008
Sold by
Sun Trust Mortgage Inc
Bought by
Dlj Mortgage Capital Inc
Purchase Details
Closed on
Feb 6, 2008
Sold by
Dlj Mortgage Capital Inc
Bought by
Quinlan Patrick J
Purchase Details
Closed on
Mar 31, 2006
Sold by
First Creek Farm Condominiums Llc
Bought by
Wilson Paul
Home Financials for this Owner
Home Financials are based on the most recent Mortgage that was taken out on this home.
Original Mortgage
$95,563
Interest Rate
8.37%
Mortgage Type
Fannie Mae Freddie Mac
Create a Home Valuation Report for This Property
The Home Valuation Report is an in-depth analysis detailing your home's value as well as a comparison with similar homes in the area
Home Values in the Area
Average Home Value in this Area
Purchase History
| Date | Buyer | Sale Price | Title Company |
|---|---|---|---|
| Quinlan Rebecca B | -- | None Available | |
| Quinlan Rebecca B | $500 | None Available | |
| Suntrust Mortgage Inc | -- | None Available | |
| Dlj Mortgage Capital Inc | -- | None Available | |
| Quinlan Patrick J | $80,500 | None Available | |
| Wilson Paul | $4,500 | Fahtco | |
| Wilson Paul | $132,019 | Fahtco |
Source: Public Records
Mortgage History
| Date | Status | Borrower | Loan Amount |
|---|---|---|---|
| Previous Owner | Wilson Paul | $95,563 | |
| Previous Owner | Wilson Paul | $40,956 |
Source: Public Records
Tax History Compared to Growth
Tax History
| Year | Tax Paid | Tax Assessment Tax Assessment Total Assessment is a certain percentage of the fair market value that is determined by local assessors to be the total taxable value of land and additions on the property. | Land | Improvement |
|---|---|---|---|---|
| 2024 | $2,356 | $18,690 | $3,880 | $14,810 |
| 2023 | $2,384 | $20,830 | $3,040 | $17,790 |
| 2022 | $2,501 | $15,950 | $3,130 | $12,820 |
| 2021 | $2,577 | $15,950 | $3,130 | $12,820 |
| 2020 | $2,605 | $16,280 | $3,220 | $13,060 |
| 2019 | $2,601 | $16,280 | $3,220 | $13,060 |
| 2018 | $2,073 | $12,630 | $560 | $12,070 |
| 2017 | $2,011 | $12,630 | $560 | $12,070 |
| 2016 | $1,250 | $8,070 | $620 | $7,450 |
| 2015 | $1,223 | $8,070 | $620 | $7,450 |
| 2014 | $818 | $5,340 | $620 | $4,720 |
Source: Public Records
Map
Nearby Homes
- 5765 N Genoa Way Unit 1-208
- 5745 N Genoa Way Unit 306
- 19805 E 58th Place
- 5705 N Genoa Way Unit 206
- 5703 N Gibralter Way Unit 103
- 5703 N Gibralter Way Unit 6-206
- 5714 N Gibralter Way Unit 102
- 5714 N Gibralter Way Unit 5204
- The Cumberland | Residence 39123 Plan at Painted Prairie - The Haven II Collection
- The Powell | Residence 39206 Plan at Painted Prairie - The Haven II Collection
- The Marion | Residence 39208 Plan at Painted Prairie - The Haven II Collection
- 20211 E 57th Ave
- 19880 E 59th Place
- 20231 E 57th Ave
- 24374 E 42nd Ave
- 20261 E 57th Ave
- 20291 E 57th Ave
- 20109 Randolph Place
- 6576 N Nepal St
- 19681 E 59th Place
- 5765 N Genoa Way Unit 1-104
- 5765 N Genoa Way Unit 1201
- 5765 N Genoa Way Unit 1107
- 5765 N Genoa Way Unit 1207
- 5765 N Genoa Way Unit 1105
- 5765 N Genoa Way Unit 1205
- 5765 N Genoa Way Unit 1103
- 5765 N Genoa Way Unit 203
- 5765 N Genoa Way Unit 1101
- 5765 N Genoa Way
- 5765 N Genoa Way Unit 1-202
- 5765 N Genoa Way Unit 1102
- 5765 N Genoa Way Unit 1304
- 5765 N Genoa Way Unit 1204
- 5765 N Genoa Way Unit 1104
- 5765 N Genoa Way Unit 1306
- 5765 N Genoa Way Unit 1206
- 5765 N Genoa Way Unit 1106
- 5765 N Genoa Way Unit 208
- 5765 N Genoa Way Unit 1108