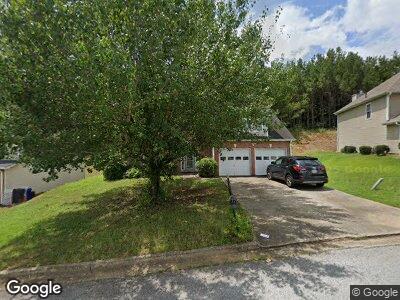
5765 Winchester Place Lithonia, GA 30038
Lithonia NeighborhoodEstimated Value: $285,000 - $334,000
4
Beds
3
Baths
2,279
Sq Ft
$135/Sq Ft
Est. Value
About This Home
This home is located at 5765 Winchester Place, Lithonia, GA 30038 and is currently estimated at $308,016, approximately $135 per square foot. 5765 Winchester Place is a home located in DeKalb County with nearby schools including Flat Rock Elementary School, Salem Middle School, and Martin Luther King- Jr. High School.
Ownership History
Date
Name
Owned For
Owner Type
Purchase Details
Closed on
Jul 29, 2011
Sold by
Secretary Of Housing And U
Bought by
Bennett Andrea
Current Estimated Value
Home Financials for this Owner
Home Financials are based on the most recent Mortgage that was taken out on this home.
Original Mortgage
$77,537
Outstanding Balance
$55,444
Interest Rate
4.75%
Mortgage Type
FHA
Estimated Equity
$249,748
Purchase Details
Closed on
Jun 1, 2010
Sold by
Wells Fargo Bk Na
Bought by
Hud-Housing Of Urban Dev
Purchase Details
Closed on
Jan 7, 2000
Sold by
Greenwood Homes Inc
Bought by
Allen Barbara
Home Financials for this Owner
Home Financials are based on the most recent Mortgage that was taken out on this home.
Original Mortgage
$129,448
Interest Rate
7.8%
Mortgage Type
FHA
Create a Home Valuation Report for This Property
The Home Valuation Report is an in-depth analysis detailing your home's value as well as a comparison with similar homes in the area
Home Values in the Area
Average Home Value in this Area
Purchase History
| Date | Buyer | Sale Price | Title Company |
|---|---|---|---|
| Bennett Andrea | $75,000 | -- | |
| Hud-Housing Of Urban Dev | -- | -- | |
| Wells Fargo Bk Na | $163,413 | -- | |
| Allen Barbara | $129,600 | -- |
Source: Public Records
Mortgage History
| Date | Status | Borrower | Loan Amount |
|---|---|---|---|
| Open | Bennett Andrea | $77,537 | |
| Previous Owner | Allen Barbara | $144,000 | |
| Previous Owner | Allen Barbara | $136,559 | |
| Previous Owner | Allen Barbara | $129,448 |
Source: Public Records
Tax History Compared to Growth
Tax History
| Year | Tax Paid | Tax Assessment Tax Assessment Total Assessment is a certain percentage of the fair market value that is determined by local assessors to be the total taxable value of land and additions on the property. | Land | Improvement |
|---|---|---|---|---|
| 2023 | $3,113 | $106,440 | $6,880 | $99,560 |
| 2022 | $2,596 | $94,960 | $6,880 | $88,080 |
| 2021 | $2,088 | $72,040 | $6,880 | $65,160 |
| 2020 | $1,888 | $63,880 | $6,880 | $57,000 |
| 2019 | $1,759 | $57,800 | $6,880 | $50,920 |
| 2018 | $1,515 | $53,600 | $6,880 | $46,720 |
| 2017 | $1,610 | $49,160 | $6,880 | $42,280 |
| 2016 | $1,334 | $41,160 | $6,880 | $34,280 |
| 2014 | $1,264 | $39,200 | $6,880 | $32,320 |
Source: Public Records
Map
Nearby Homes
- 6900 Winchester Place
- 5704 Winchester Place
- 5755 Belmont Ridge Cir
- 4046 Crossvale Rd
- 5678 Mill View Way
- 4161 Windermere Dr
- 5320 Flat Rock Point
- 5344 Flat Rock Point
- 5491 Marble Dr
- 5483 Marble Dr
- 5706 Spring Mill Cir
- 4155 Eliza Dr
- 3932 E Saddle Ridge Dr
- 5624 Browns Mill Rd
- 5441 Flat Rock Point
- 5441 Flat Rock Point Unit 4125
- 5436 Flat Rock Point
- 6090 Ancestors Dr
- 6080 Ancestors Dr
- 5765 Winchester Place
- 5771 Winchester Place
- 5759 Winchester Place
- 5777 Winchester Place
- 5753 Winchester Place
- 3960 Heritage Pointe
- 5803 Belmont Ridge Cir
- 5797 Belmont Ridge Cir
- 0 Belmont Ridge Ct Unit 8372390
- 5750 Winchester Place
- 5807 Belmont Ridge Cir
- 5785 Winchester Place
- 5886 Manchester Ln
- 5747 Winchester Place
- 5791 Belmont Ridge Cir
- 5892 Manchester Ln
- 5786 Winchester Place
- 5778 Winchester Place
- 3950 Heritage Pointe
- 5880 Manchester Ln