Estimated Value: $669,000
12
Beds
8
Baths
4,800
Sq Ft
$139/Sq Ft
Est. Value
About This Home
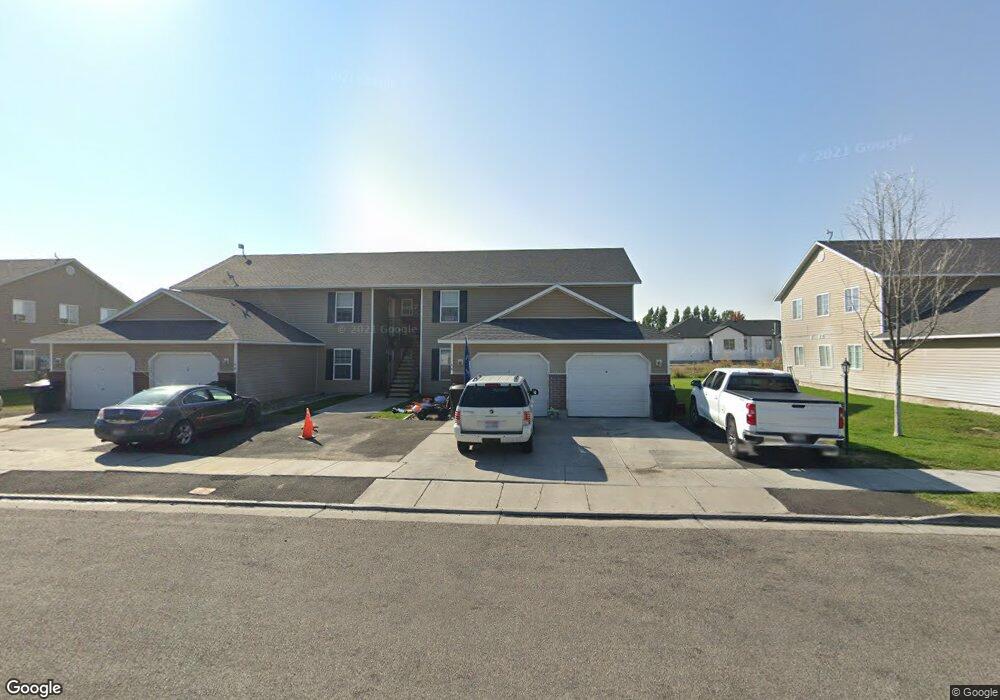
This home is located at 577 Caribou St Unit 7-10, Rigby, ID 83442 and is currently estimated at $669,000, approximately $139 per square foot. 577 Caribou St Unit 7-10 is a home located in Jefferson County with nearby schools including Jefferson Elementary School, Rigby Middle School, and Rigby High School.
Ownership History
Date
Name
Owned For
Owner Type
Purchase Details
Closed on
Mar 7, 2018
Sold by
Peterson Morgan
Bought by
Peterson Morgan J and Peterson Lacie L
Current Estimated Value
Home Financials for this Owner
Home Financials are based on the most recent Mortgage that was taken out on this home.
Original Mortgage
$224,000
Outstanding Balance
$191,950
Interest Rate
4.38%
Mortgage Type
New Conventional
Estimated Equity
$477,050
Purchase Details
Closed on
Aug 6, 2009
Sold by
Mathis Wilbert Joe
Bought by
Thomas Terry Ross and Thomas Cathleen Christy
Purchase Details
Closed on
Dec 1, 2006
Sold by
Thomas Terry Ross and Thomas Cathleen Christy
Bought by
Mathis Joe
Purchase Details
Closed on
May 20, 2005
Sold by
Arave Construction Co Inc
Bought by
Thomas Terry Ross and Thomas Cathleen Christy
Home Financials for this Owner
Home Financials are based on the most recent Mortgage that was taken out on this home.
Original Mortgage
$229,450
Interest Rate
6.75%
Mortgage Type
Adjustable Rate Mortgage/ARM
Create a Home Valuation Report for This Property
The Home Valuation Report is an in-depth analysis detailing your home's value as well as a comparison with similar homes in the area
Home Values in the Area
Average Home Value in this Area
Purchase History
| Date | Buyer | Sale Price | Title Company |
|---|---|---|---|
| Peterson Morgan J | -- | Alliance Title Rexburg Offic | |
| Thomas Terry Ross | $312,004 | -- | |
| Mathis Joe | -- | -- | |
| Thomas Terry Ross | -- | -- |
Source: Public Records
Mortgage History
| Date | Status | Borrower | Loan Amount |
|---|---|---|---|
| Open | Peterson Morgan J | $224,000 | |
| Previous Owner | Thomas Terry Ross | $229,450 |
Source: Public Records
Tax History Compared to Growth
Tax History
| Year | Tax Paid | Tax Assessment Tax Assessment Total Assessment is a certain percentage of the fair market value that is determined by local assessors to be the total taxable value of land and additions on the property. | Land | Improvement |
|---|---|---|---|---|
| 2024 | $4,530 | $444,360 | $0 | $0 |
| 2023 | $4,530 | $423,200 | $0 | $0 |
| 2022 | $5,038 | $381,000 | $0 | $0 |
| 2021 | $6,291 | $368,000 | $0 | $0 |
| 2020 | $5,294 | $352,748 | $0 | $0 |
| 2019 | $6,038 | $318,127 | $0 | $0 |
| 2018 | $5,821 | $283,121 | $0 | $0 |
| 2017 | $5,522 | $256,193 | $0 | $0 |
| 2016 | $5,400 | $248,115 | $0 | $0 |
| 2015 | $5,174 | $228,439 | $0 | $0 |
| 2014 | $5,109 | $225,828 | $0 | $0 |
| 2013 | -- | $204,939 | $0 | $0 |
Source: Public Records
Map
Nearby Homes
- 577 Caribou St
- 577 Caribou St Unit D
- 577 Caribou St Unit A-D
- 565 Caribou St
- 581 Caribou St
- 574 Foxhill
- L16B3 Pheasant Cir
- 562 Foxhill
- 576 Caribou St
- 593 Caribou St
- 553 Caribou St
- TBD Foxhill Dr
- LOT 5 Foxhill Dr
- LOT 1 Foxhill Dr
- 580 Caribou St
- 564 Caribou St
- 564 Caribou St
- 564 Caribou St Unit C
- 596 Foxhill
- 550 Foxhill