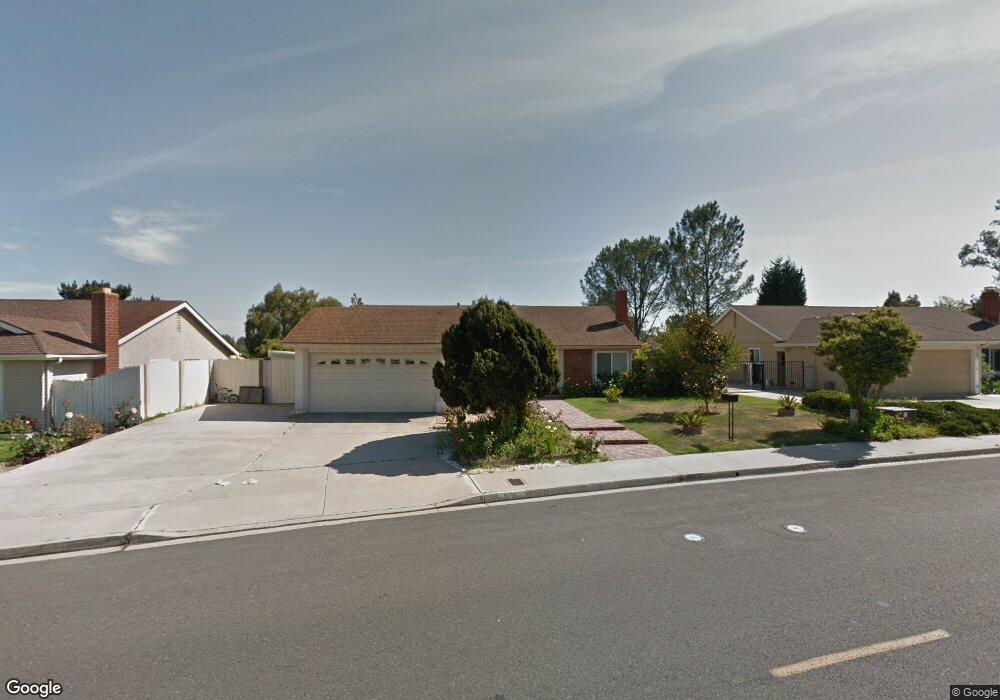
577 Willowspring Dr S Encinitas, CA 92024
Central Encinitas NeighborhoodEstimated Value: $1,596,000 - $1,884,000
4
Beds
2
Baths
1,750
Sq Ft
$1,002/Sq Ft
Est. Value
About This Home
This home is located at 577 Willowspring Dr S, Encinitas, CA 92024 and is currently estimated at $1,753,034, approximately $1,001 per square foot. 577 Willowspring Dr S is a home located in San Diego County with nearby schools including Ocean Knoll Elementary School, Oak Crest Middle School, and La Costa Canyon High School.
Ownership History
Date
Name
Owned For
Owner Type
Purchase Details
Closed on
Jul 11, 2017
Sold by
Mohtadi Ghorban Ali and Mahtadi Mabuash
Bought by
Mohtadi Cohorban Ali and Mahradi Mahvash
Current Estimated Value
Purchase Details
Closed on
Jan 27, 2016
Sold by
Mohtadi Ghorban Ali
Bought by
Ghorban Ali Mohtadi & Mahvash Mohtadi Re
Purchase Details
Closed on
Jan 7, 2011
Sold by
Mohtadi Ghorban Ali
Bought by
Mohtadi Ghorban Ali and Mohtadi Mahvash
Home Financials for this Owner
Home Financials are based on the most recent Mortgage that was taken out on this home.
Original Mortgage
$175,200
Interest Rate
4.43%
Mortgage Type
New Conventional
Purchase Details
Closed on
Nov 30, 2001
Sold by
Mohtadi Mahvash
Bought by
Mohtadi Ghorban Ali
Home Financials for this Owner
Home Financials are based on the most recent Mortgage that was taken out on this home.
Original Mortgage
$275,000
Interest Rate
6.57%
Create a Home Valuation Report for This Property
The Home Valuation Report is an in-depth analysis detailing your home's value as well as a comparison with similar homes in the area
Home Values in the Area
Average Home Value in this Area
Purchase History
| Date | Buyer | Sale Price | Title Company |
|---|---|---|---|
| Mohtadi Cohorban Ali | -- | None Available | |
| Ghorban Ali Mohtadi & Mahvash Mohtadi Re | -- | None Available | |
| Mohtadi Ghorban Ali | -- | Westminster Title Company In | |
| Mohtadi Ghorban Ali | -- | Chicago Title Co |
Source: Public Records
Mortgage History
| Date | Status | Borrower | Loan Amount |
|---|---|---|---|
| Closed | Mohtadi Ghorban Ali | $175,200 | |
| Closed | Mohtadi Ghorban Ali | $275,000 |
Source: Public Records
Tax History
| Year | Tax Paid | Tax Assessment Tax Assessment Total Assessment is a certain percentage of the fair market value that is determined by local assessors to be the total taxable value of land and additions on the property. | Land | Improvement |
|---|---|---|---|---|
| 2025 | $1,441 | $87,686 | $20,764 | $66,922 |
| 2024 | $1,441 | $85,967 | $20,357 | $65,610 |
| 2023 | $1,358 | $84,282 | $19,958 | $64,324 |
| 2022 | $1,296 | $82,630 | $19,567 | $63,063 |
| 2021 | $1,245 | $81,011 | $19,184 | $61,827 |
| 2020 | $1,199 | $80,182 | $18,988 | $61,194 |
| 2019 | $1,181 | $78,611 | $18,616 | $59,995 |
| 2018 | $1,163 | $77,070 | $18,251 | $58,819 |
| 2017 | $1,146 | $75,560 | $17,894 | $57,666 |
| 2016 | $1,119 | $74,080 | $17,544 | $56,536 |
| 2015 | $1,076 | $72,968 | $17,281 | $55,687 |
| 2014 | $1,033 | $71,540 | $16,943 | $54,597 |
Source: Public Records
Map
Nearby Homes
- 608 Crest Dr
- 1528 Calle Narcisos
- 1549 Avenida de Las Adelsas
- 363 Orwell Ln
- 0 Crest Dr Unit 250045003
- 110 Turner Ave
- 1280 Santa fe Dr
- 803 Hollyridge Dr
- 1240 Berryman Canyon
- 1862 Pleasantdale Ln
- 1025 Monterey Vista Way
- 1010 Scarlet Way
- 1866 Forestdale Dr
- 1011 Monterey Vista Way
- 1341 Berryman Canyon
- 1331 Berryman Canyon
- 245 Fairlee Ln
- 1517 Shields Ave
- 1376 Tennis Club Dr
- 1386 Lake Dr
- 571 Willowspring Dr S
- 601 Willowspring Dr S
- 1450 Pegaso St
- 1444 Pegaso St
- 603 Willowspring Dr S
- 1456 Pegaso St
- 1438 Pegaso St
- 330 Oakbranch Dr
- 326 Oakbranch Dr
- 321 Firtree Ct
- 1462 Pegaso St
- 324 Firtree Ct
- 1432 Pegaso St
- 607 Willowspring Dr S
- 320 Oakbranch Dr
- 1468 Pegaso St
- 320 Firtree Ct
- 1426 Pegaso St
- 315 Firtree Ct
- 615 Willowspring Dr S
Your Personal Tour Guide
Ask me questions while you tour the home.