Estimated Value: $661,000 - $901,000
3
Beds
2
Baths
1,241
Sq Ft
$603/Sq Ft
Est. Value
About This Home
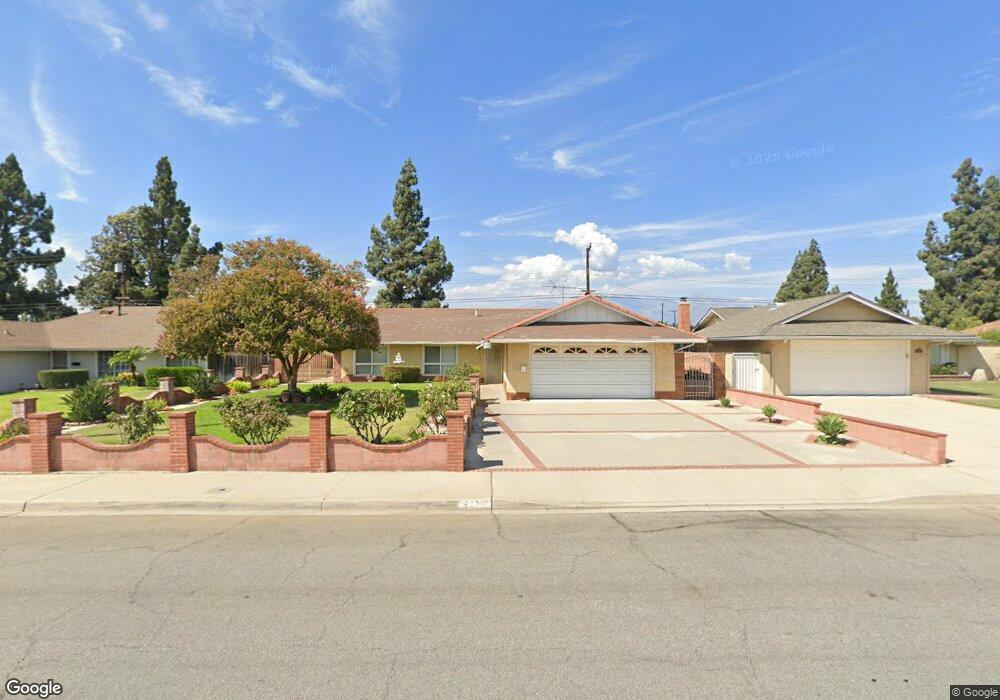
This home is located at 5770 Harrison St, Chino, CA 91710 and is currently estimated at $747,729, approximately $602 per square foot. 5770 Harrison St is a home located in San Bernardino County with nearby schools including Walnut Avenue Elementary, Magnolia Junior High, and Chino High School.
Ownership History
Date
Name
Owned For
Owner Type
Purchase Details
Closed on
Jan 25, 2013
Sold by
Treffry Ruby
Bought by
Treffry Ruby and Treffry Family Trust
Current Estimated Value
Purchase Details
Closed on
Mar 28, 2012
Sold by
Treffry Ruby
Bought by
Treffry Ruby
Home Financials for this Owner
Home Financials are based on the most recent Mortgage that was taken out on this home.
Original Mortgage
$83,000
Outstanding Balance
$56,621
Interest Rate
3.65%
Mortgage Type
New Conventional
Estimated Equity
$691,108
Purchase Details
Closed on
Feb 27, 2008
Sold by
Treffry Jaime and Treffry Ruby
Bought by
Treffry Jaime and Treffry Ruby
Purchase Details
Closed on
Mar 22, 1994
Sold by
Treffry Jaime and Treffry Jamie
Bought by
Treffry Jaime and Treffry Ruby
Home Financials for this Owner
Home Financials are based on the most recent Mortgage that was taken out on this home.
Original Mortgage
$78,000
Interest Rate
7.15%
Create a Home Valuation Report for This Property
The Home Valuation Report is an in-depth analysis detailing your home's value as well as a comparison with similar homes in the area
Home Values in the Area
Average Home Value in this Area
Purchase History
| Date | Buyer | Sale Price | Title Company |
|---|---|---|---|
| Treffry Ruby | -- | Accommodation | |
| Treffry Ruby | -- | Pacific Coast Title | |
| Treffry Jaime | -- | None Available | |
| Treffry Jaime | -- | Old Republic Title Company |
Source: Public Records
Mortgage History
| Date | Status | Borrower | Loan Amount |
|---|---|---|---|
| Open | Treffry Ruby | $83,000 | |
| Closed | Treffry Jaime | $78,000 |
Source: Public Records
Tax History
| Year | Tax Paid | Tax Assessment Tax Assessment Total Assessment is a certain percentage of the fair market value that is determined by local assessors to be the total taxable value of land and additions on the property. | Land | Improvement |
|---|---|---|---|---|
| 2025 | $1,865 | $172,390 | $43,571 | $128,819 |
| 2024 | $1,814 | $169,010 | $42,717 | $126,293 |
| 2023 | $1,763 | $165,696 | $41,879 | $123,817 |
| 2022 | $1,751 | $162,447 | $41,058 | $121,389 |
| 2021 | $1,715 | $159,262 | $40,253 | $119,009 |
| 2020 | $1,692 | $157,629 | $39,840 | $117,789 |
| 2019 | $1,662 | $154,538 | $39,059 | $115,479 |
| 2018 | $1,624 | $151,508 | $38,293 | $113,215 |
| 2017 | $1,594 | $148,537 | $37,542 | $110,995 |
| 2016 | $1,489 | $145,625 | $36,806 | $108,819 |
| 2015 | $1,458 | $143,437 | $36,253 | $107,184 |
| 2014 | $1,428 | $140,627 | $35,543 | $105,084 |
Source: Public Records
Map
Nearby Homes
- 12346 Cedar Ave
- 12446 Chestnut Place
- 12524 Ross Ave
- 12321 Gardenia Place
- 12644 Oaks Ave
- 2321 S Magnolia Ave Unit 12 C
- 1961 S Almond Ave
- 6221 Garfield St
- 1106 W Philadelphia St
- 2046 S Mountain Ave
- 11873 Seneca Way
- 2015 S Mountain Ave
- 5195 Walnut Ave Unit 14
- 5925 Riverside Dr Unit 12
- 926 W Philadelphia St Unit Q93
- 12400 Cypress Ave Unit 45
- 12951 Benson Ave Unit 142
- 12124 Lester Ct
- 12737 Carob Ct
- 1726 S Mountain Ave Unit C
- 5760 Harrison St
- 5780 Harrison St
- 5750 Harrison St
- 5790 Harrison St
- 12335 Cedar Ave
- 12336 Holly Ave
- 5740 Harrison St
- 5810 Harrison St
- 12345 Cedar Ave
- 12346 Holly Ave
- 5730 Harrison St
- 5820 Harrison St
- 12355 Cedar Ave
- 12356 Holly Ave
- 12335 Holly Ave
- 12336 Cedar Ave
- 12345 Holly Ave
- 5720 Harrison St
- 5830 Harrison St
- 12365 Cedar Ave
Your Personal Tour Guide
Ask me questions while you tour the home.