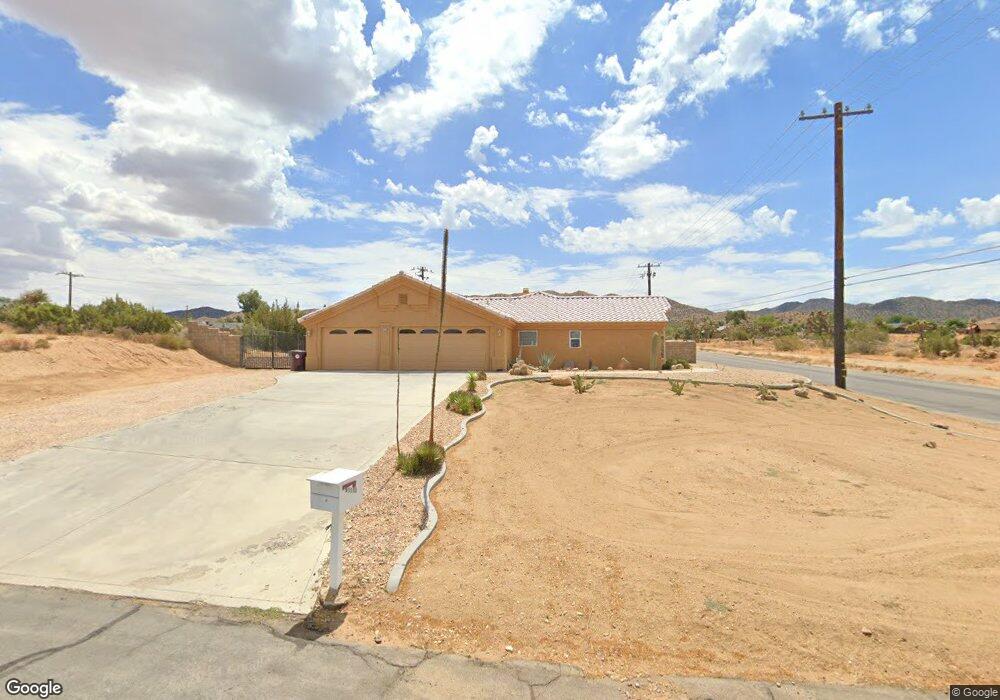
57713 Ivanhoe Dr Yucca Valley, CA 92284
Estimated Value: $496,000 - $617,000
3
Beds
2
Baths
2,036
Sq Ft
$263/Sq Ft
Est. Value
About This Home
This home is located at 57713 Ivanhoe Dr, Yucca Valley, CA 92284 and is currently estimated at $535,983, approximately $263 per square foot. 57713 Ivanhoe Dr is a home located in San Bernardino County with nearby schools including Onaga Elementary School, La Contenta Middle School, and Yucca Valley High School.
Ownership History
Date
Name
Owned For
Owner Type
Purchase Details
Closed on
Sep 27, 2011
Sold by
Skyline Vista Equities Llc
Bought by
Keenan Marie Antoinette
Current Estimated Value
Purchase Details
Closed on
Aug 30, 2011
Sold by
Strong Phil
Bought by
Skyline Vista Equities Llc
Purchase Details
Closed on
Sep 3, 2003
Sold by
Lander Don M
Bought by
Strong Phil and Lewis Tanya E
Home Financials for this Owner
Home Financials are based on the most recent Mortgage that was taken out on this home.
Original Mortgage
$188,000
Interest Rate
6.27%
Mortgage Type
Purchase Money Mortgage
Purchase Details
Closed on
Dec 17, 2002
Sold by
Stroud Naomi Ruth
Bought by
Lander Don M and Lander Margaret
Home Financials for this Owner
Home Financials are based on the most recent Mortgage that was taken out on this home.
Original Mortgage
$140,000
Interest Rate
6.06%
Create a Home Valuation Report for This Property
The Home Valuation Report is an in-depth analysis detailing your home's value as well as a comparison with similar homes in the area
Home Values in the Area
Average Home Value in this Area
Purchase History
| Date | Buyer | Sale Price | Title Company |
|---|---|---|---|
| Keenan Marie Antoinette | $190,000 | Fidelity National Title | |
| Skyline Vista Equities Llc | $125,300 | Fidelity National Title Co | |
| Strong Phil | $235,000 | Fidelity National Title | |
| Lander Don M | $15,000 | First American |
Source: Public Records
Mortgage History
| Date | Status | Borrower | Loan Amount |
|---|---|---|---|
| Previous Owner | Strong Phil | $188,000 | |
| Previous Owner | Lander Don M | $140,000 | |
| Closed | Strong Phil | $23,500 |
Source: Public Records
Tax History
| Year | Tax Paid | Tax Assessment Tax Assessment Total Assessment is a certain percentage of the fair market value that is determined by local assessors to be the total taxable value of land and additions on the property. | Land | Improvement |
|---|---|---|---|---|
| 2025 | $3,563 | $257,489 | $25,121 | $232,368 |
| 2024 | $3,403 | $252,440 | $24,628 | $227,812 |
| 2023 | $3,271 | $247,490 | $24,145 | $223,345 |
| 2022 | $3,132 | $242,638 | $23,672 | $218,966 |
| 2021 | $3,134 | $237,881 | $23,208 | $214,673 |
| 2020 | $3,110 | $235,442 | $22,970 | $212,472 |
| 2019 | $3,040 | $230,826 | $22,520 | $208,306 |
| 2018 | $2,813 | $226,300 | $22,078 | $204,222 |
| 2017 | $2,687 | $221,863 | $21,645 | $200,218 |
| 2016 | $2,637 | $217,513 | $21,221 | $196,292 |
| 2015 | $2,577 | $214,246 | $20,902 | $193,344 |
| 2014 | $2,554 | $210,050 | $20,493 | $189,557 |
Source: Public Records
Map
Nearby Homes
- 1234 Ivanhoe Dr
- 57716 Juarez Dr
- 57826 Joshua Ln
- 57731 San Tropeze Dr
- 57795 El Dorado Dr
- 17 San Diego Dr
- 57934 Juarez Dr
- 57885 El Dorado Dr
- 57866 El Dorado Dr
- 8668 Frontera Ave
- 8582 Frontera Ave
- 57980 San Andreas Rd
- 57420 San Andreas Rd
- 8747 Balsa Ave
- 58055 Desert Gold Dr
- 8520 Bolero Dr
- 8837 Hardesty Dr
- 987 Juarez Dr
- 0 Joshua Ln Unit 219143457DA
- 123 Joshua Ln
- 0 Ivanhoe Dr Unit JT18226036
- 0 Ivanhoe Dr Unit DC21130001
- 0 Ivanhoe Dr Unit DC14195798
- 0 Ivanhoe Dr Unit JT15108472
- 0 Ivanhoe Dr Unit CRTR24217344
- 0 Ivanhoe Dr Unit TR24217344
- 0 Ivanhoe Dr Unit IV23078815
- 0 Ivanhoe Dr Unit JT19020170
- 57749 Ivanhoe Dr
- 57732 Juarez Dr
- 57718 Ivanhoe Dr
- 0 Ivanhoe Dr @ Warren Vista Unit 41331719DA
- 57734 Ivanhoe Dr Unit B
- 57746 Juarez Dr
- 57740 Ivanhoe Dr
- 57764 Juarez Dr
- 8585 Warren Vista Ave
- 57780 Juarez Dr
- 57759 Ivanhoe Dr
- 8719 Warren Vista Ave
Your Personal Tour Guide
Ask me questions while you tour the home.