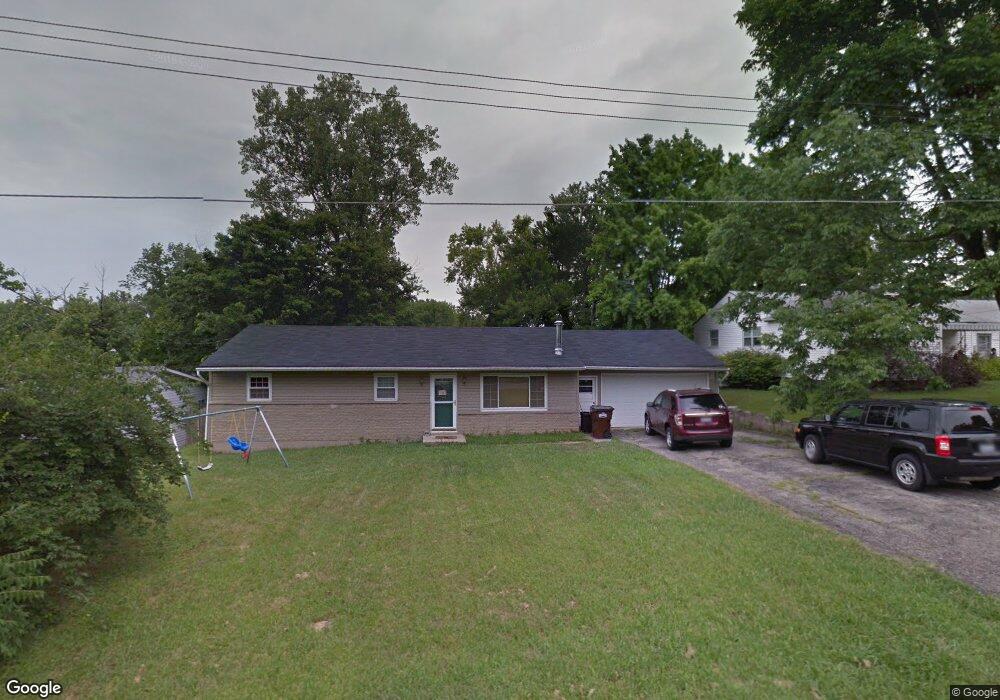
5772 Lynn St Franklin, OH 45005
Estimated Value: $135,000 - $227,000
3
Beds
1
Bath
1,144
Sq Ft
$173/Sq Ft
Est. Value
About This Home
This home is located at 5772 Lynn St, Franklin, OH 45005 and is currently estimated at $197,474, approximately $172 per square foot. 5772 Lynn St is a home located in Warren County with nearby schools including Franklin High School, Summit Academy Community School for Alternative Learners - Middletown, and Summit Academy Secondary School - Middletown.
Ownership History
Date
Name
Owned For
Owner Type
Purchase Details
Closed on
Jan 18, 2002
Sold by
Wannemacher James J
Bought by
Banks Carl R
Current Estimated Value
Home Financials for this Owner
Home Financials are based on the most recent Mortgage that was taken out on this home.
Original Mortgage
$94,007
Outstanding Balance
$38,088
Interest Rate
6.92%
Mortgage Type
FHA
Estimated Equity
$159,386
Purchase Details
Closed on
Jan 11, 2001
Sold by
Key Floyd
Bought by
Chase Manhattan Mtg Corp
Purchase Details
Closed on
Dec 30, 1988
Sold by
First National Bank Of Wa
Bought by
Floyd Key and Floyd K.
Purchase Details
Closed on
Oct 27, 1988
Sold by
Kalbaugh Kalbaugh and Kalbaugh David A
Bought by
First National Bank Of Wa
Purchase Details
Closed on
Dec 3, 1984
Sold by
Chaney Joseph Reid and Chaney Dil
Bought by
Kalbaugh and Kalbaugh David A
Purchase Details
Closed on
Jun 2, 1978
Sold by
Williamson Williamson and Williamson James D
Create a Home Valuation Report for This Property
The Home Valuation Report is an in-depth analysis detailing your home's value as well as a comparison with similar homes in the area
Home Values in the Area
Average Home Value in this Area
Purchase History
| Date | Buyer | Sale Price | Title Company |
|---|---|---|---|
| Banks Carl R | $94,750 | -- | |
| Chase Manhattan Mtg Corp | $62,000 | -- | |
| Floyd Key | $55,000 | -- | |
| First National Bank Of Wa | $30,000 | -- | |
| Kalbaugh | $46,000 | -- | |
| -- | $35,000 | -- |
Source: Public Records
Mortgage History
| Date | Status | Borrower | Loan Amount |
|---|---|---|---|
| Open | Banks Carl R | $94,007 |
Source: Public Records
Tax History Compared to Growth
Tax History
| Year | Tax Paid | Tax Assessment Tax Assessment Total Assessment is a certain percentage of the fair market value that is determined by local assessors to be the total taxable value of land and additions on the property. | Land | Improvement |
|---|---|---|---|---|
| 2024 | $2,122 | $48,050 | $15,080 | $32,970 |
| 2023 | $1,768 | $36,011 | $7,910 | $28,101 |
| 2022 | $1,728 | $36,012 | $7,910 | $28,102 |
| 2021 | $1,632 | $36,012 | $7,910 | $28,102 |
| 2020 | $1,571 | $30,517 | $6,703 | $23,814 |
| 2019 | $1,482 | $30,517 | $6,703 | $23,814 |
| 2018 | $1,410 | $30,517 | $6,703 | $23,814 |
| 2017 | $1,361 | $26,590 | $5,985 | $20,605 |
| 2016 | $1,390 | $26,590 | $5,985 | $20,605 |
| 2015 | $1,390 | $26,590 | $5,985 | $20,605 |
| 2014 | $1,431 | $26,590 | $5,990 | $20,600 |
| 2013 | $1,207 | $29,780 | $6,700 | $23,080 |
Source: Public Records
Map
Nearby Homes
- 5845 Manchester Rd
- 5756 Union Rd
- 25 Timber Creek Dr
- 220 Pleasant Hill Blvd
- 60 Pleasant Hill Blvd
- 5696 Woodcreek Dr
- 5667 Woodcreek Dr
- 6777 Crystal Harbour Dr
- 5714 Millbrook Dr
- 6795 Crystal Harbour Dr
- 4640 Shaker Rd
- 5760 Autumn Dr
- 6772 Rivulet Dr
- 5031 Gerber Dr
- 5019 Waterford Ln
- Creekside Paired Villa Plan at Waterford Place
- 4821 Manchester Rd
- 4964 Timberline Dr Unit 81
- 209 Arcadia Dr
- 5758 Lynn St
- 5788 Lynn St
- 5787 Manchester Rd
- 5744 Lynn St
- 5802 Lynn St
- 5771 Manchester Rd
- 5801 Manchester Rd
- 5771 Lynn St
- 5757 Lynn St
- 5815 Manchester Rd
- 5728 Lynn St
- 5452 Hinton St
- 5801 Lynn St
- 5743 Lynn St
- 5745 Manchester Rd
- 5825 Manchester Rd
- 5815 Lynn St
- 5727 Lynn St
- 5716 Lynn St
- 5758 Manchester Rd