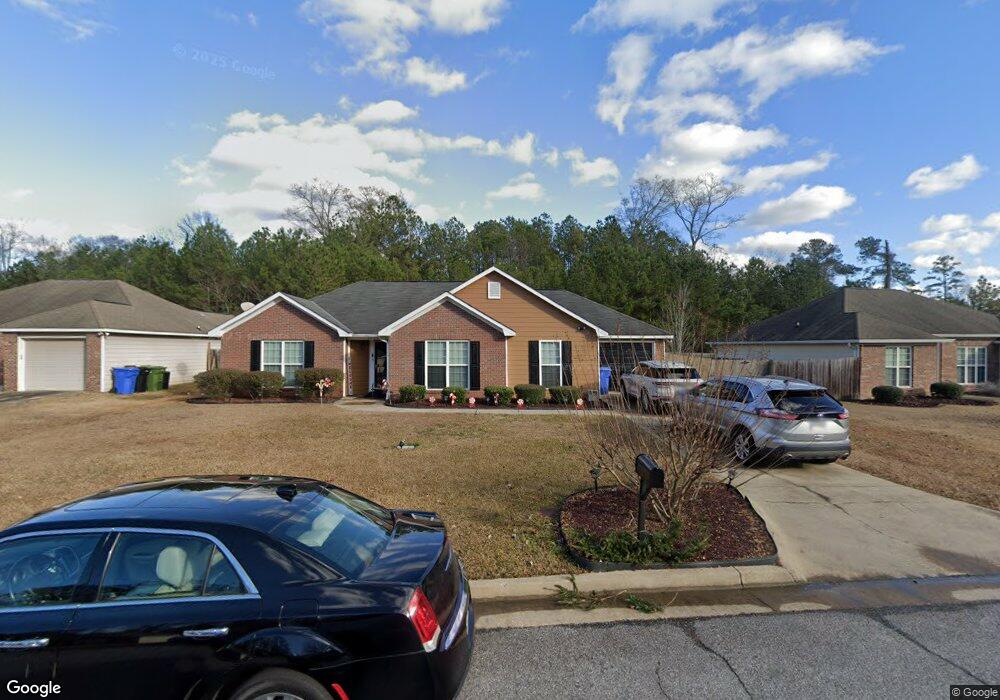
5773 Gleneden Dr Columbus, GA 31907
Eastern Columbus NeighborhoodEstimated Value: $185,000 - $199,000
3
Beds
3
Baths
1,508
Sq Ft
$128/Sq Ft
Est. Value
About This Home
This home is located at 5773 Gleneden Dr, Columbus, GA 31907 and is currently estimated at $192,528, approximately $127 per square foot. 5773 Gleneden Dr is a home located in Muscogee County with nearby schools including Forrest Road Elementary School, Fort Middle School, and Kendrick High School.
Ownership History
Date
Name
Owned For
Owner Type
Purchase Details
Closed on
Sep 18, 2019
Sold by
Payne Angela
Bought by
Payne Angela and Payne Calvin E
Current Estimated Value
Purchase Details
Closed on
Sep 4, 2014
Sold by
Powers Investments Inc
Bought by
Willis Angela D
Home Financials for this Owner
Home Financials are based on the most recent Mortgage that was taken out on this home.
Original Mortgage
$97,206
Interest Rate
4.4%
Mortgage Type
FHA
Purchase Details
Closed on
Jun 25, 2014
Sold by
Sec Of Veterans Affa
Bought by
Powers Investments Llc
Home Financials for this Owner
Home Financials are based on the most recent Mortgage that was taken out on this home.
Original Mortgage
$59,150
Interest Rate
4.17%
Mortgage Type
New Conventional
Purchase Details
Closed on
Feb 11, 2014
Sold by
Phh Mtg Corp
Bought by
Sec Of Veterans Affairs
Purchase Details
Closed on
Feb 4, 2014
Sold by
Harris Earl K
Bought by
Phh Mtg Corp
Create a Home Valuation Report for This Property
The Home Valuation Report is an in-depth analysis detailing your home's value as well as a comparison with similar homes in the area
Home Values in the Area
Average Home Value in this Area
Purchase History
| Date | Buyer | Sale Price | Title Company |
|---|---|---|---|
| Payne Angela | -- | -- | |
| Willis Angela D | $99,000 | -- | |
| Powers Investments Llc | $58,500 | -- | |
| Sec Of Veterans Affairs | $102,060 | -- | |
| Phh Mtg Corp | $102,060 | -- |
Source: Public Records
Mortgage History
| Date | Status | Borrower | Loan Amount |
|---|---|---|---|
| Previous Owner | Willis Angela D | $97,206 | |
| Previous Owner | Powers Investments Llc | $59,150 |
Source: Public Records
Tax History Compared to Growth
Tax History
| Year | Tax Paid | Tax Assessment Tax Assessment Total Assessment is a certain percentage of the fair market value that is determined by local assessors to be the total taxable value of land and additions on the property. | Land | Improvement |
|---|---|---|---|---|
| 2025 | $1,034 | $70,940 | $15,476 | $55,464 |
| 2024 | $1,033 | $70,940 | $15,476 | $55,464 |
| 2023 | $345 | $70,940 | $15,476 | $55,464 |
| 2022 | $1,077 | $59,880 | $15,476 | $44,404 |
| 2021 | $1,070 | $40,560 | $15,476 | $25,084 |
| 2020 | $1,071 | $44,988 | $15,476 | $29,512 |
| 2019 | $1,076 | $44,988 | $15,476 | $29,512 |
| 2018 | $1,076 | $44,988 | $15,476 | $29,512 |
| 2017 | $1,081 | $44,988 | $15,476 | $29,512 |
| 2016 | $1,086 | $39,600 | $11,200 | $28,400 |
| 2015 | $1,088 | $39,600 | $11,200 | $28,400 |
| 2014 | $952 | $57,544 | $11,200 | $46,344 |
| 2013 | -- | $57,544 | $11,200 | $46,344 |
Source: Public Records
Map
Nearby Homes
- 5833 Gleneden Dr
- 2525 Corineth Dr
- 5920 Gleneden Dr
- 5929 Gleneden Dr
- 2807 Doyle Ave
- 6059 Nassau Cir
- 5906 Forrest Rd
- 2940 Urban Ave
- 6000 Caribou Dr
- 6028 Caribou Dr
- 2672 Honeysuckle Dr
- 3027 Lansing Ave
- 2501 White Chapel Dr
- 2505 White Chapel Dr
- 3301 Musket Dr
- 5759 Forrest Rd
- 2249 Mahan Dr
- 6916 Bradshaw Dr
- 5225 Orange Dr
- 2307 Skylake Dr
- 5765 Gleneden Dr
- 5781 Gleneden Dr
- 5757 Gleneden Dr
- 5797 Gleneden Dr
- 2521 Gleneden Ct
- 5813 Gleneden Dr
- 2513 Gleneden Ct
- 0 Gleneden Dr
- 5772 Gleneden Dr
- 5749 Gleneden Dr
- 5764 Gleneden Dr
- 5780 Gleneden Dr
- 2501 Gleneden Ct
- 5756 Gleneden Dr
- 2529 Gleneden Ct
- 5796 Gleneden Dr
- 5740 Gleneden Dr
- 5748 Gleneden Dr
- 2522 Gleneden Ct
- 5804 Gleneden Dr