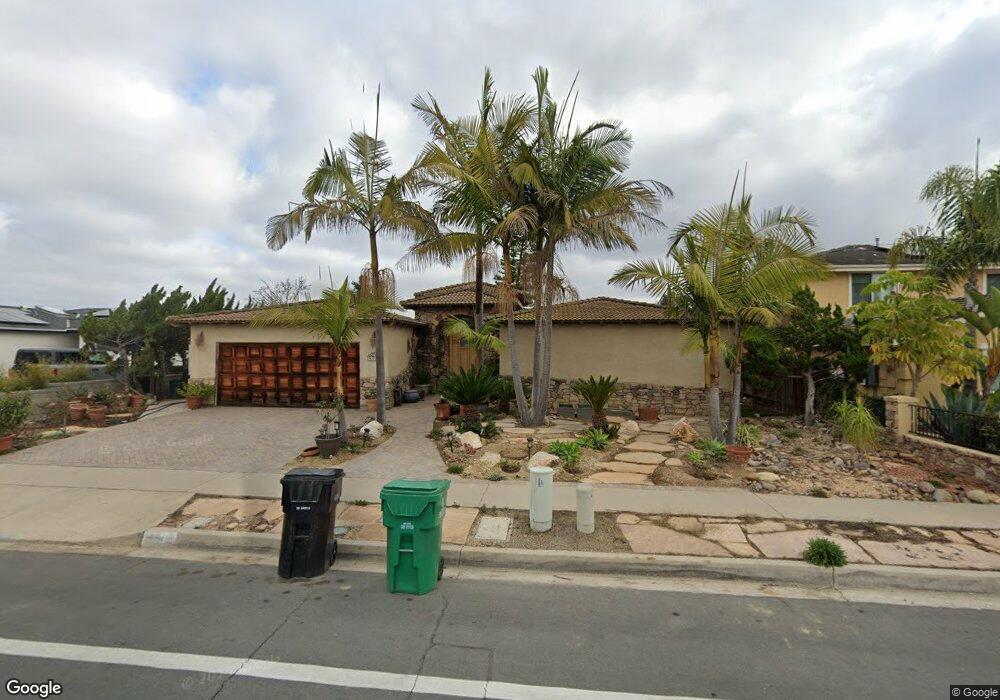
5775 Soledad Mountain Rd La Jolla, CA 92037
Soledad South NeighborhoodEstimated Value: $1,693,000 - $3,134,000
3
Beds
2
Baths
2,668
Sq Ft
$899/Sq Ft
Est. Value
About This Home
This home is located at 5775 Soledad Mountain Rd, La Jolla, CA 92037 and is currently estimated at $2,397,638, approximately $898 per square foot. 5775 Soledad Mountain Rd is a home located in San Diego County with nearby schools including La Jolla Elementary School, Muirlands Middle School, and La Jolla High School.
Ownership History
Date
Name
Owned For
Owner Type
Purchase Details
Closed on
Mar 11, 2022
Sold by
Taylor Esther E
Bought by
Esther Taylor Rev Living Trust
Current Estimated Value
Purchase Details
Closed on
May 21, 1998
Sold by
Taylor Esther E and Lundgren Esther E
Bought by
Taylor Esther E
Home Financials for this Owner
Home Financials are based on the most recent Mortgage that was taken out on this home.
Original Mortgage
$25,000
Interest Rate
6.76%
Mortgage Type
Stand Alone Second
Purchase Details
Closed on
Mar 17, 1997
Sold by
Lundgren Steven R
Bought by
Lundgren Esther E
Home Financials for this Owner
Home Financials are based on the most recent Mortgage that was taken out on this home.
Original Mortgage
$217,500
Interest Rate
7.86%
Create a Home Valuation Report for This Property
The Home Valuation Report is an in-depth analysis detailing your home's value as well as a comparison with similar homes in the area
Home Values in the Area
Average Home Value in this Area
Purchase History
| Date | Buyer | Sale Price | Title Company |
|---|---|---|---|
| Esther Taylor Rev Living Trust | -- | None Listed On Document | |
| Taylor Esther E | -- | Fidelity National Title | |
| Lundgren Esther E | -- | Fidelity National Title Co | |
| Lundgren Esther E | $290,000 | Fidelity National Title Co |
Source: Public Records
Mortgage History
| Date | Status | Borrower | Loan Amount |
|---|---|---|---|
| Previous Owner | Taylor Esther E | $25,000 | |
| Previous Owner | Lundgren Esther E | $217,500 |
Source: Public Records
Tax History
| Year | Tax Paid | Tax Assessment Tax Assessment Total Assessment is a certain percentage of the fair market value that is determined by local assessors to be the total taxable value of land and additions on the property. | Land | Improvement |
|---|---|---|---|---|
| 2025 | $3,407 | $287,161 | $50,791 | $236,370 |
| 2024 | $3,407 | $281,532 | $49,796 | $231,736 |
| 2023 | $3,329 | $276,013 | $48,820 | $227,193 |
| 2022 | $3,239 | $270,602 | $47,863 | $222,739 |
| 2021 | $3,216 | $265,297 | $46,925 | $218,372 |
| 2020 | $3,176 | $262,577 | $46,444 | $216,133 |
| 2019 | $3,118 | $257,430 | $45,534 | $211,896 |
| 2018 | $2,915 | $252,384 | $44,642 | $207,742 |
| 2017 | $2,844 | $247,436 | $43,767 | $203,669 |
| 2016 | $2,796 | $242,585 | $42,909 | $199,676 |
| 2015 | $2,754 | $238,942 | $42,265 | $196,677 |
| 2014 | $2,710 | $234,263 | $41,438 | $192,825 |
Source: Public Records
Map
Nearby Homes
- 5777 Desert View Dr Unit 358-381-14-00
- 5628 Desert View Dr
- 5580 Caminito Consuelo
- 5576 Caminito Herminia
- 2448 Sagebrush Ct
- 6077 Firwood Row
- 2434 Ridgegate Row
- 5515 Thunderbird Ln
- 2538 Caminito Muirfield
- 5455 Parkview Dr
- 5435 Parkview Dr
- 1609 Caminito Asterisco
- 2170 Via Nina
- 4694 Leathers St
- 5979 Via Zurita
- 1617 Calle Alta
- 6645 Caminito Scioto
- 2663 Tonto Way
- 2045 Avila Ct
- 2105 Harbour Heights Rd
- 5785 Soledad Mountain Rd
- 5765 Soledad Mountain Rd
- 5755 Soledad Mountain Rd
- 2701 Palomino Cir
- 2715 Palomino Cir
- 5776 Desert View Dr
- 5812 Desert View Dr
- 5770 Soledad Mountain Rd
- 5782 Soledad Mountain Rd
- 5762 Desert View Dr
- 5758 Soledad Mountain Rd
- 2691 Palomino Cir
- 5801 Soledad Mountain Rd
- 5735 Soledad Mountain Rd
- 5746 Soledad Mountain Rd
- 2733 Palomino Cir
- 5828 Desert View Dr
- 5748 Desert View Dr
- 5736 Soledad Mountain Rd
- 2692 Palomino Cir
Your Personal Tour Guide
Ask me questions while you tour the home.