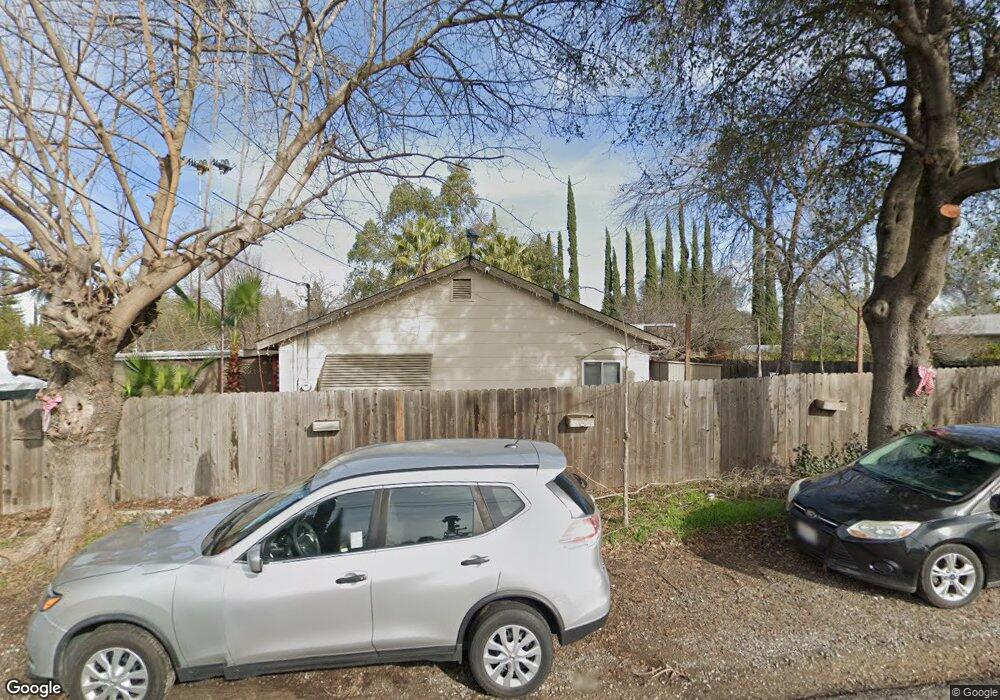
5775 Webb St Loomis, CA 95650
Estimated Value: $406,000
2
Beds
1
Bath
856
Sq Ft
$474/Sq Ft
Est. Value
About This Home
This home is located at 5775 Webb St, Loomis, CA 95650 and is currently estimated at $406,000, approximately $474 per square foot. 5775 Webb St is a home located in Placer County with nearby schools including Del Oro High School, Loomis Basin Charter School, and Holy Cross Lutheran Academy.
Ownership History
Date
Name
Owned For
Owner Type
Purchase Details
Closed on
Nov 2, 2018
Sold by
Carl Rozanne and Zimick Rozanne C
Bought by
Lee Carl Rozanne
Current Estimated Value
Home Financials for this Owner
Home Financials are based on the most recent Mortgage that was taken out on this home.
Original Mortgage
$295,000
Outstanding Balance
$256,786
Interest Rate
4.7%
Mortgage Type
New Conventional
Estimated Equity
$149,214
Purchase Details
Closed on
Jul 27, 2010
Sold by
Nelthorpe Donna Lee
Bought by
Zimicki Rozanne C
Home Financials for this Owner
Home Financials are based on the most recent Mortgage that was taken out on this home.
Original Mortgage
$168,936
Interest Rate
4.71%
Mortgage Type
FHA
Purchase Details
Closed on
Dec 8, 1998
Sold by
Nelthorpe Edwin F and Nelthorpe Donnalee
Bought by
Nelthorpe Edwin F and Nelthorpe Donna Lee
Purchase Details
Closed on
Dec 22, 1994
Sold by
Haney Angelina
Bought by
Nelthorpe Edwin F and Nelthorpe Donnalee
Create a Home Valuation Report for This Property
The Home Valuation Report is an in-depth analysis detailing your home's value as well as a comparison with similar homes in the area
Home Values in the Area
Average Home Value in this Area
Purchase History
| Date | Buyer | Sale Price | Title Company |
|---|---|---|---|
| Lee Carl Rozanne | -- | Chicago Title | |
| Zimicki Rozanne C | $145,000 | Placer Title Company | |
| Nelthorpe Edwin F | -- | -- | |
| Nelthorpe Edwin F | $88,500 | Chicago Title Company |
Source: Public Records
Mortgage History
| Date | Status | Borrower | Loan Amount |
|---|---|---|---|
| Open | Lee Carl Rozanne | $295,000 | |
| Closed | Zimicki Rozanne C | $168,936 |
Source: Public Records
Tax History
| Year | Tax Paid | Tax Assessment Tax Assessment Total Assessment is a certain percentage of the fair market value that is determined by local assessors to be the total taxable value of land and additions on the property. | Land | Improvement |
|---|---|---|---|---|
| 2025 | $2,713 | $227,625 | $128,110 | $99,515 |
| 2023 | $2,713 | $218,788 | $123,137 | $95,651 |
| 2022 | $2,646 | $214,499 | $120,723 | $93,776 |
| 2021 | $2,573 | $210,294 | $118,356 | $91,938 |
| 2020 | $2,596 | $208,139 | $117,143 | $90,996 |
| 2019 | $2,490 | $204,059 | $114,847 | $89,212 |
| 2018 | $2,362 | $200,059 | $112,596 | $87,463 |
| 2017 | $2,317 | $196,138 | $110,389 | $85,749 |
| 2016 | $2,263 | $192,293 | $108,225 | $84,068 |
| 2015 | $2,213 | $189,406 | $106,600 | $82,806 |
| 2014 | $2,116 | $180,000 | $101,300 | $78,700 |
Source: Public Records
Map
Nearby Homes
- 0 Webb St
- 5782 King Rd
- 3437 Taylor Rd
- 6300 Arcadia Ave
- 6139 Smoke Wood Ct
- 3390 Taylor Rd Unit 12
- 6100 Helens Ct
- 3586 Sun Knoll Dr
- 5750 Connie Ct
- 5567 Myrtle Dr
- 3420 Grove Cir
- 6154 S Walnut St Unit 40
- 6244 S Walnut St
- 3361 Clayton Ln
- 3838 Circle Dr
- 3899 Martin Ln
- 3955 Stonegate Ct
- 3301 Stone Field Way
- 5833 Mareta Ln
- 3360 Cherokee Trail
Your Personal Tour Guide
Ask me questions while you tour the home.