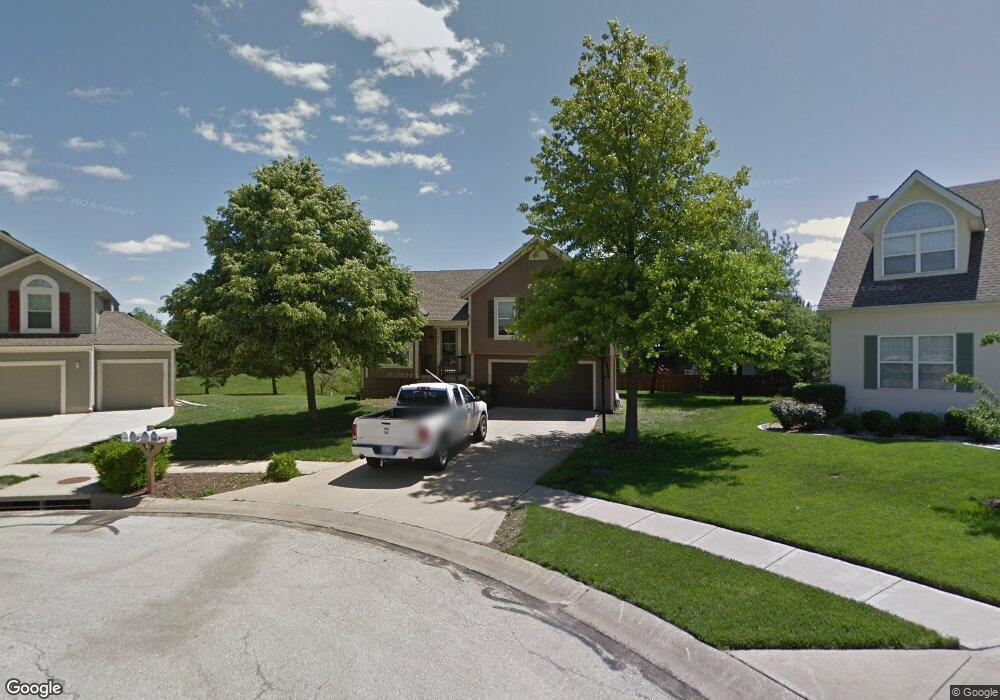
5777 Meadow Height Dr Shawnee, KS 66226
Estimated Value: $375,000 - $427,000
3
Beds
3
Baths
1,525
Sq Ft
$258/Sq Ft
Est. Value
About This Home
This home is located at 5777 Meadow Height Dr, Shawnee, KS 66226 and is currently estimated at $393,338, approximately $257 per square foot. 5777 Meadow Height Dr is a home located in Johnson County with nearby schools including Belmont Elementary School, Mill Creek Middle School, and De Soto High School.
Ownership History
Date
Name
Owned For
Owner Type
Purchase Details
Closed on
Mar 9, 2018
Sold by
Pennington Jason Ray and Pennington Suzanne L
Bought by
Walker James
Current Estimated Value
Home Financials for this Owner
Home Financials are based on the most recent Mortgage that was taken out on this home.
Original Mortgage
$226,227
Outstanding Balance
$192,358
Interest Rate
4.15%
Mortgage Type
VA
Estimated Equity
$200,980
Purchase Details
Closed on
Mar 12, 2014
Sold by
Pennington Rhonda Sue and Pennington Jason Ray
Bought by
Pennington Jason Ray
Purchase Details
Closed on
May 21, 2004
Sold by
Murray Steven Brian and Murray Erin
Bought by
Pennington Jason B and Pennington Rhonda S
Home Financials for this Owner
Home Financials are based on the most recent Mortgage that was taken out on this home.
Original Mortgage
$137,200
Interest Rate
5.93%
Mortgage Type
Purchase Money Mortgage
Create a Home Valuation Report for This Property
The Home Valuation Report is an in-depth analysis detailing your home's value as well as a comparison with similar homes in the area
Home Values in the Area
Average Home Value in this Area
Purchase History
| Date | Buyer | Sale Price | Title Company |
|---|---|---|---|
| Walker James | -- | Continental Title | |
| Pennington Jason Ray | -- | None Available | |
| Pennington Jason B | -- | Chicago Title Insurance Co |
Source: Public Records
Mortgage History
| Date | Status | Borrower | Loan Amount |
|---|---|---|---|
| Open | Walker James | $226,227 | |
| Previous Owner | Pennington Jason B | $137,200 | |
| Closed | Pennington Jason B | $34,150 |
Source: Public Records
Tax History Compared to Growth
Tax History
| Year | Tax Paid | Tax Assessment Tax Assessment Total Assessment is a certain percentage of the fair market value that is determined by local assessors to be the total taxable value of land and additions on the property. | Land | Improvement |
|---|---|---|---|---|
| 2024 | $4,472 | $38,629 | $7,510 | $31,119 |
| 2023 | $4,598 | $39,135 | $7,510 | $31,625 |
| 2022 | $4,178 | $34,845 | $6,523 | $28,322 |
| 2021 | $3,763 | $30,095 | $6,211 | $23,884 |
| 2020 | $3,425 | $27,128 | $6,211 | $20,917 |
| 2019 | $3,307 | $25,806 | $5,406 | $20,400 |
| 2018 | $3,099 | $24,736 | $5,406 | $19,330 |
| 2017 | $3,198 | $24,127 | $4,700 | $19,427 |
| 2016 | $3,057 | $22,770 | $4,700 | $18,070 |
| 2015 | $3,000 | $22,034 | $4,701 | $17,333 |
| 2013 | -- | $20,458 | $4,701 | $15,757 |
Source: Public Records
Map
Nearby Homes
- 5625 Meadow View Dr
- 6122 Lewis Dr
- 6118 Lewis Dr
- 6114 Lewis Dr
- 6108 Lewis Dr
- 24207 W 58th Place
- 6119 Lewis Dr
- 6115 Lewis Dr
- The Paxton III Plan at Canyon Lakes
- The Sydney III Plan at Canyon Lakes
- The Harlow V Plan at Canyon Lakes
- The Hailey Plan at Canyon Lakes
- The Brooklyn II Plan at Canyon Lakes
- The Niko Plan at Canyon Lakes
- The Payton Plan at Canyon Lakes
- The Aspen Plan at Canyon Lakes
- The Levi II Plan at Canyon Lakes
- The Madison Plan at Canyon Lakes
- The Ellsworth Plan at Canyon Lakes
- The Dakota Plan at Canyon Lakes
- 5777 Meadow Heights Dr
- 5781 Meadow Heights Dr
- 23508 W 58th St
- 5803 Meadow Heights Dr
- 23512 W 58th St
- 5769 Meadow Height Dr
- 5769 Meadow Heights Dr
- 23504 W 58th St
- 23516 W 58th St
- 5807 Meadow Heights Dr
- 5765 Meadow Heights Dr
- 23602 W 58th St
- 23500 W 58th St
- 5790 Meadow Heights Dr
- 5811 Meadow Heights Dr
- 23505 W 58th St
- 5730 Meadow Sweet Ln
- 23509 W 58th St
- 23606 W 58th St
- 5755 Meadow Heights Dr