
Estimated payment $2,477/month
Highlights
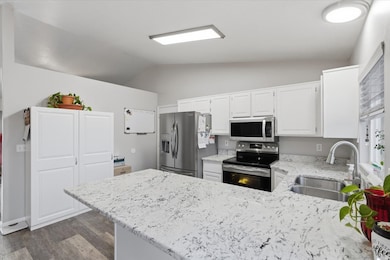
- Updated Kitchen
- Mountain View
- Granite Countertops
- Mature Trees
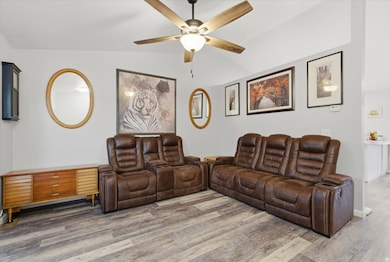
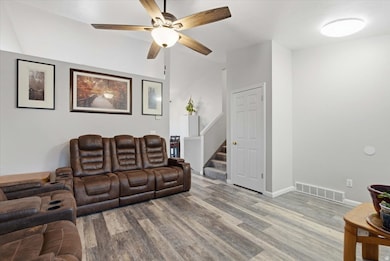
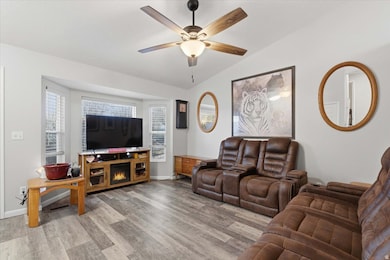
- Vaulted Ceiling
- No HOA
About This Home
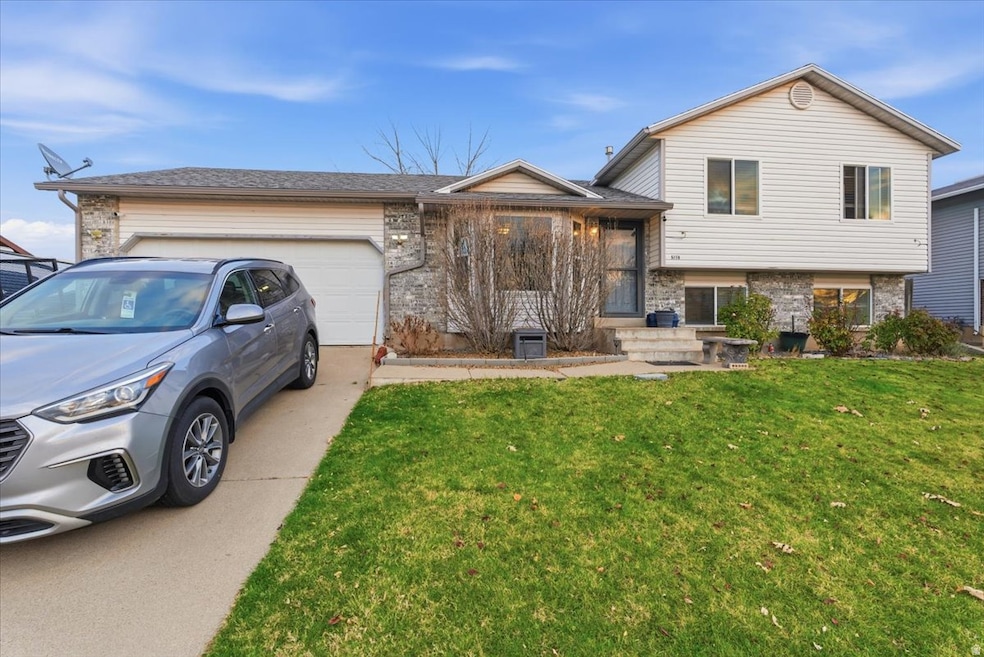
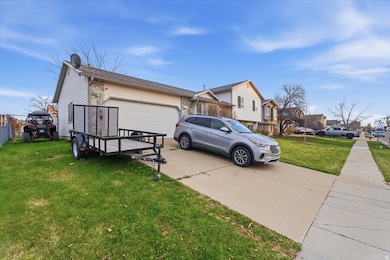
Welcome home to this absolutely charming and beautifully updated single-family gem in one of Roy's most beloved neighborhoods! With 4 spacious bedrooms, 2 bathrooms, and 1,542 sq ft of thoughtfully designed living space, this home blends modern upgrades with cozy comfort in every corner. Step inside to find a freshly renovated interior --- a bright, stylish kitchen, updated flooring, new paint, and warm, elegant lighting that makes the entire home feel brand-new. The extra-long garage offers wonderful storage or workspace options. The backyard is truly a retreat! Enjoy a lovely greenhouse, a lifetime shed, and your own mini orchard with peach and apple trees, a blackberry bush, and sweet grape vines --- perfect for gardeners, hobbyists, and anyone who loves outdoor living. Plus, the permanent Jelly Lights installed just two years ago add a magical glow year-round. Major improvements give you peace of mind, including a newer furnace and AC (2018), new windows and doors (2020), and a new roof (2020). Tucked in a peaceful location close to grocery stores, great schools, and Emma Russell Park, this home truly offers the perfect mix of convenience, charm, and modern comfort. A rare find you'll fall in love with the moment you arrive! Square footage figures are provided as a courtesy estimate only and were obtained from county records . Buyer is advised to obtain an independent measurement.
Listing Agent
Maria Sanchez-Serrano
KW South Valley Keller Williams License #12596823 Listed on: 11/26/2025
Open House Schedule
-
Saturday, November 29, 20251:00 to 3:00 pm11/29/2025 1:00:00 PM +00:0011/29/2025 3:00:00 PM +00:00Add to Calendar
Home Details
Home Type
- Single Family
Est. Annual Taxes
- $2,242
Year Built
- Built in 1994
Lot Details
- 6,970 Sq Ft Lot
- Property is Fully Fenced
- Landscaped
- Sprinkler System
- Mature Trees
- Property is zoned Single-Family
Parking
- 2 Car Garage
Home Design
- Brick Exterior Construction
Interior Spaces
- 1,542 Sq Ft Home
- 3-Story Property
- Vaulted Ceiling
- Double Pane Windows
- Blinds
- Sliding Doors
- Mountain Views
- Basement Fills Entire Space Under The House
- Storm Doors
- Electric Dryer Hookup
Kitchen
- Updated Kitchen
- Built-In Range
- Microwave
- Granite Countertops
- Disposal
Flooring
- Carpet
- Tile
Bedrooms and Bathrooms
- 4 Bedrooms
Outdoor Features
- Open Patio
- Storage Shed
Schools
- Freedom Elementary School
- Roy Middle School
- Roy High School
Utilities
- Forced Air Heating and Cooling System
- Natural Gas Connected
Community Details
- No Home Owners Association
- Aland Of Honey # 8 Subdivision
Listing and Financial Details
- Exclusions: Dryer, Washer
- Assessor Parcel Number 09-279-0016
Map
Home Values in the Area
Average Home Value in this Area
Tax History
| Year | Tax Paid | Tax Assessment Tax Assessment Total Assessment is a certain percentage of the fair market value that is determined by local assessors to be the total taxable value of land and additions on the property. | Land | Improvement |
|---|---|---|---|---|
| 2025 | $2,242 | $397,199 | $135,000 | $262,199 |
| 2024 | $2,169 | $212,849 | $74,257 | $138,592 |
| 2023 | $2,092 | $205,700 | $65,968 | $139,732 |
| 2022 | $2,350 | $235,400 | $60,501 | $174,899 |
| 2021 | $1,769 | $294,000 | $80,017 | $213,983 |
| 2020 | $1,564 | $238,000 | $80,017 | $157,983 |
| 2019 | $1,621 | $233,000 | $45,048 | $187,952 |
| 2018 | $1,486 | $202,000 | $39,924 | $162,076 |
| 2017 | $1,389 | $178,000 | $39,924 | $138,076 |
| 2016 | $1,296 | $89,563 | $21,415 | $68,148 |
| 2015 | $1,119 | $79,756 | $21,415 | $58,341 |
| 2014 | $984 | $69,350 | $18,611 | $50,739 |
Property History
| Date | Event | Price | List to Sale | Price per Sq Ft |
|---|---|---|---|---|
| 11/26/2025 11/26/25 | For Sale | $435,000 | -- | $282 / Sq Ft |
Purchase History
| Date | Type | Sale Price | Title Company |
|---|---|---|---|
| Interfamily Deed Transfer | -- | None Available | |
| Warranty Deed | -- | None Available | |
| Interfamily Deed Transfer | -- | Mountain View Title Ogden | |
| Interfamily Deed Transfer | -- | Associated Title |
Mortgage History
| Date | Status | Loan Amount | Loan Type |
|---|---|---|---|
| Open | $150,228 | FHA | |
| Previous Owner | $120,200 | New Conventional |
Source: UtahRealEstate.com
MLS Number: 2124607
APN: 09-279-0016
Disclaimer: Certain information contained herein is derived from information provided by parties other than Homes.com. All information provided is deemed reliable, but is not guaranteed to be accurate and should be independently verified.
![]() IDX information is provided exclusively for consumers’ personal, non-commercial use, that it may not be used for any purpose other than to identify prospective properties consumers may be interested in purchasing, and that the data is deemed reliable but is not guaranteed accurate by the MLS. Licensor is only providing the MLS Content and not other sources of data provided in the Product.
IDX information is provided exclusively for consumers’ personal, non-commercial use, that it may not be used for any purpose other than to identify prospective properties consumers may be interested in purchasing, and that the data is deemed reliable but is not guaranteed accurate by the MLS. Licensor is only providing the MLS Content and not other sources of data provided in the Product.
Based on information from the Wasatch Front Regional Multiple Listing Service, Inc.. All data, including all measurements and calculations of area, is obtained from various sources and has not been, and will not be, verified by broker or the MLS. All information should be independently reviewed and verified for accuracy. Properties may or may not be listed by the office/agent presenting the information.