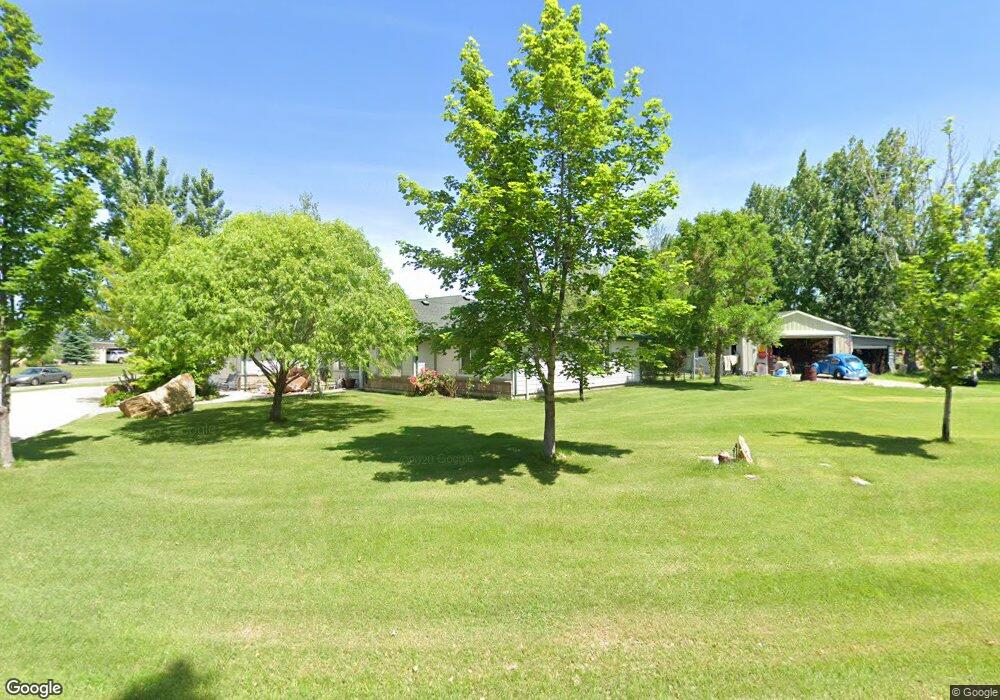
5778 W 4350 S Hooper, UT 84315
Estimated Value: $636,000 - $684,216
3
Beds
2
Baths
1,650
Sq Ft
$397/Sq Ft
Est. Value
About This Home
This home is located at 5778 W 4350 S, Hooper, UT 84315 and is currently estimated at $654,804, approximately $396 per square foot. 5778 W 4350 S is a home located in Weber County with nearby schools including Hooper Elementary School, Rocky Mountain Junior High School, and Quest Academy.
Ownership History
Date
Name
Owned For
Owner Type
Purchase Details
Closed on
Sep 26, 2007
Sold by
Hill Stanley and Hill Sandra
Bought by
Smith Ronald L and Smith Kathleen K
Current Estimated Value
Purchase Details
Closed on
Sep 30, 2002
Sold by
Hill Stanley H and Hill Sandra L
Bought by
Hill Stanley and Hill Sandra
Home Financials for this Owner
Home Financials are based on the most recent Mortgage that was taken out on this home.
Original Mortgage
$122,000
Interest Rate
6.22%
Purchase Details
Closed on
Jun 18, 2001
Sold by
Windley Rick D and Windley Diana K
Bought by
Scott Diana Leigh
Purchase Details
Closed on
Apr 24, 2000
Sold by
Roholt Thomas M and Roholt Barbara S
Bought by
Hill Stanley H and Hill Sandra L
Home Financials for this Owner
Home Financials are based on the most recent Mortgage that was taken out on this home.
Original Mortgage
$106,000
Interest Rate
8.24%
Purchase Details
Closed on
Sep 30, 1996
Sold by
Michael Stewart Homes Inc
Bought by
Pledger Jeffrey D and Pledger Dana
Home Financials for this Owner
Home Financials are based on the most recent Mortgage that was taken out on this home.
Original Mortgage
$106,000
Interest Rate
7.95%
Create a Home Valuation Report for This Property
The Home Valuation Report is an in-depth analysis detailing your home's value as well as a comparison with similar homes in the area
Home Values in the Area
Average Home Value in this Area
Purchase History
| Date | Buyer | Sale Price | Title Company |
|---|---|---|---|
| Smith Ronald L | -- | First American Legend Hills | |
| Hill Stanley | -- | Mountain View Title | |
| Scott Diana Leigh | -- | -- | |
| Hill Stanley H | -- | Mountain View Title | |
| Pledger Jeffrey D | -- | Cardon Land Title |
Source: Public Records
Mortgage History
| Date | Status | Borrower | Loan Amount |
|---|---|---|---|
| Previous Owner | Hill Stanley | $122,000 | |
| Previous Owner | Hill Stanley H | $106,000 | |
| Previous Owner | Pledger Jeffrey D | $106,000 |
Source: Public Records
Tax History
| Year | Tax Paid | Tax Assessment Tax Assessment Total Assessment is a certain percentage of the fair market value that is determined by local assessors to be the total taxable value of land and additions on the property. | Land | Improvement |
|---|---|---|---|---|
| 2025 | $3,638 | $658,778 | $220,019 | $438,759 |
| 2024 | $3,638 | $355,297 | $121,010 | $234,287 |
| 2023 | $3,540 | $342,651 | $121,013 | $221,638 |
| 2022 | $715 | $354,750 | $93,476 | $261,274 |
| 2021 | $364 | $521,999 | $95,554 | $426,445 |
| 2020 | $2,885 | $460,001 | $84,932 | $375,069 |
| 2019 | $2,885 | $417,000 | $74,953 | $342,047 |
| 2018 | $0 | $412,000 | $67,980 | $344,020 |
| 2017 | $2,547 | $340,999 | $68,016 | $272,983 |
| 2016 | $2,597 | $187,734 | $35,063 | $152,671 |
| 2015 | -- | $124,689 | $35,063 | $89,626 |
| 2014 | -- | $113,682 | $35,063 | $78,619 |
Source: Public Records
Map
Nearby Homes
- 4129 S 5800 W Unit 4
- 4146 S 5800 W Unit 5
- 4194 S 5800 W Unit 14
- 4168 S 5800 W Unit 12
- 4179 S 5800 W Unit 1
- 4163 S 5800 W Unit 2
- 3729 S 5600 W Unit 6
- 3720 S 5600 W Unit 2
- 3732 S 5600 W Unit 3
- 3719 S 5600 W Unit 7
- 5957 W 4700 S
- 5577 W 4000 S
- 6036 W 4700 S
- 4111 S 5350 W
- 3842 S 5675 W
- 3706 S 5650 W Unit 9
- 3691 S 5600 W Unit 20
- 4879 S 5050 W
- 4836 S 5050 W
- 4126 S 4950 W
Your Personal Tour Guide
Ask me questions while you tour the home.