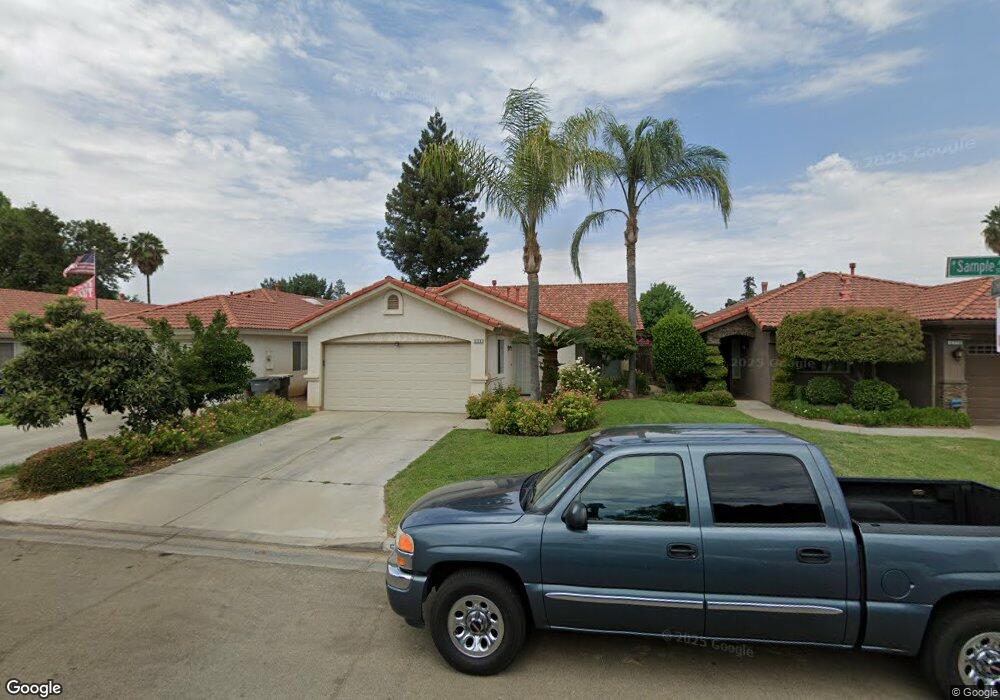
5778 W Sample Ave Fresno, CA 93722
Fig Garden Loop NeighborhoodEstimated Value: $359,000 - $373,000
3
Beds
2
Baths
1,293
Sq Ft
$282/Sq Ft
Est. Value
About This Home
This home is located at 5778 W Sample Ave, Fresno, CA 93722 and is currently estimated at $364,273, approximately $281 per square foot. 5778 W Sample Ave is a home located in Fresno County with nearby schools including William Saroyan Elementary School and Rio Vista Middle School.
Ownership History
Date
Name
Owned For
Owner Type
Purchase Details
Closed on
Mar 1, 2004
Sold by
Montalvo Suzanne
Bought by
Johnston Terry A
Current Estimated Value
Home Financials for this Owner
Home Financials are based on the most recent Mortgage that was taken out on this home.
Original Mortgage
$160,000
Outstanding Balance
$65,958
Interest Rate
4%
Mortgage Type
Purchase Money Mortgage
Estimated Equity
$298,315
Purchase Details
Closed on
Jul 2, 2002
Sold by
Wiseman Travis S and Wiseman Tina
Bought by
Montalvo Suzanne
Home Financials for this Owner
Home Financials are based on the most recent Mortgage that was taken out on this home.
Original Mortgage
$122,850
Interest Rate
6.52%
Purchase Details
Closed on
Feb 5, 1998
Sold by
Benjamin Andrew K and Farina Shelly M
Bought by
Wiseman Travis S
Home Financials for this Owner
Home Financials are based on the most recent Mortgage that was taken out on this home.
Original Mortgage
$89,250
Interest Rate
7.11%
Mortgage Type
VA
Create a Home Valuation Report for This Property
The Home Valuation Report is an in-depth analysis detailing your home's value as well as a comparison with similar homes in the area
Home Values in the Area
Average Home Value in this Area
Purchase History
| Date | Buyer | Sale Price | Title Company |
|---|---|---|---|
| Johnston Terry A | $200,000 | Financial Title Company | |
| Montalvo Suzanne | $136,500 | Financial Title Company | |
| Wiseman Travis S | $90,500 | Landmark Title Company |
Source: Public Records
Mortgage History
| Date | Status | Borrower | Loan Amount |
|---|---|---|---|
| Open | Johnston Terry A | $160,000 | |
| Previous Owner | Montalvo Suzanne | $122,850 | |
| Previous Owner | Wiseman Travis S | $89,250 |
Source: Public Records
Tax History
| Year | Tax Paid | Tax Assessment Tax Assessment Total Assessment is a certain percentage of the fair market value that is determined by local assessors to be the total taxable value of land and additions on the property. | Land | Improvement |
|---|---|---|---|---|
| 2025 | $3,529 | $278,766 | $41,807 | $236,959 |
| 2024 | $3,541 | $273,301 | $40,988 | $232,313 |
| 2023 | $3,541 | $267,943 | $40,185 | $227,758 |
| 2022 | $3,263 | $262,691 | $39,398 | $223,293 |
| 2021 | $2,969 | $232,100 | $65,800 | $166,300 |
| 2020 | $2,600 | $211,100 | $59,900 | $151,200 |
| 2019 | $2,502 | $202,100 | $57,400 | $144,700 |
| 2018 | $2,423 | $196,300 | $55,800 | $140,500 |
| 2017 | $2,343 | $185,300 | $52,700 | $132,600 |
| 2016 | $2,101 | $176,500 | $50,200 | $126,300 |
| 2015 | $2,017 | $167,400 | $47,600 | $119,800 |
| 2014 | $1,929 | $156,800 | $44,600 | $112,200 |
Source: Public Records
Map
Nearby Homes
- 6294 W Northdale Ave
- 5438 W Sample Ave
- 6009 W Goux Ave
- 5817 W Corona Ave
- 6156 N Constance Ave
- 6155 W Goux Ave
- 6583 N State Ave
- 6316 N Barcus Ave
- 6062 N Constance Ave
- 6566 N Western Ave
- 6704 N Lola Ave
- 6265 W Menlo Ave
- 5483 W Roberts Ave
- 6651 N Delbert Ave
- 5109 W Menlo Ave
- 6353 N Brix Ave
- 5093 W Los Altos Ave
- 5526 N Delbert Ave
- 6363 N Gilroy Ave
- 5427 N State St
- 5786 W Sample Ave
- 5770 W Sample Ave
- 5762 W Sample Ave
- 5794 W Sample Ave
- 5781 W Vartikian Ave
- 5789 W Vartikian Ave
- 5773 W Vartikian Ave
- 5802 W Sample Ave
- 5754 W Sample Ave
- 5797 W Vartikian Ave
- 5765 W Vartikian Ave
- 5787 W Sample Ave
- 5763 W Sample Ave
- 5757 W Vartikian Ave
- 5805 W Vartikian Ave
- 5746 W Sample Ave
- 5810 W Sample Ave
- 5795 W Sample Ave
- 5755 W Sample Ave
- 5813 W Vartikian Ave
Your Personal Tour Guide
Ask me questions while you tour the home.