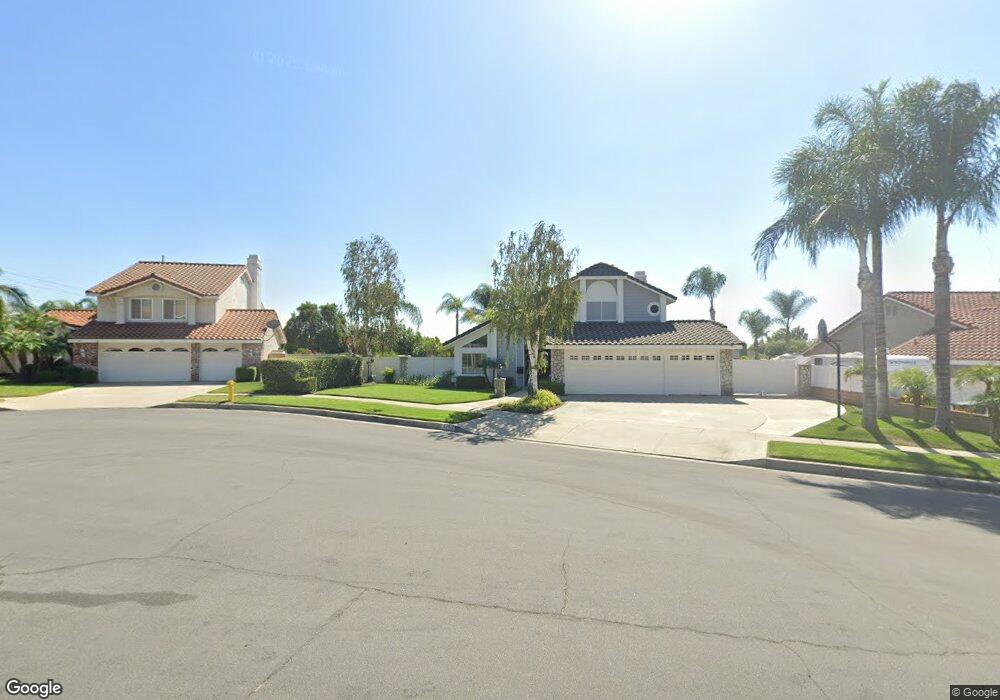
578 E Lureline Ct Upland, CA 91784
Estimated Value: $965,163 - $1,075,000
4
Beds
3
Baths
2,173
Sq Ft
$466/Sq Ft
Est. Value
About This Home
This home is located at 578 E Lureline Ct, Upland, CA 91784 and is currently estimated at $1,011,541, approximately $465 per square foot. 578 E Lureline Ct is a home located in San Bernardino County with nearby schools including Sierra Vista Elementary School, Pioneer Junior High School, and Upland High School.
Ownership History
Date
Name
Owned For
Owner Type
Purchase Details
Closed on
Aug 30, 2023
Sold by
Perez Leopoldo
Bought by
Perez Socorro
Current Estimated Value
Home Financials for this Owner
Home Financials are based on the most recent Mortgage that was taken out on this home.
Original Mortgage
$434,750
Outstanding Balance
$425,425
Interest Rate
6.9%
Mortgage Type
New Conventional
Estimated Equity
$586,116
Purchase Details
Closed on
Mar 22, 2021
Sold by
Perez Leo and Perez Socorro
Bought by
Perez Leopoldo and Perez Socorro
Purchase Details
Closed on
Dec 16, 1996
Sold by
Mcmurray Bruce E and Mc Murray Joyce
Bought by
Perez Leo and Perez Socorro
Home Financials for this Owner
Home Financials are based on the most recent Mortgage that was taken out on this home.
Original Mortgage
$207,900
Interest Rate
7.46%
Purchase Details
Closed on
Sep 2, 1993
Sold by
Prancevic Gregory Paul
Bought by
Mcmurray Bruce E and Mcmurray Joyce
Create a Home Valuation Report for This Property
The Home Valuation Report is an in-depth analysis detailing your home's value as well as a comparison with similar homes in the area
Home Values in the Area
Average Home Value in this Area
Purchase History
| Date | Buyer | Sale Price | Title Company |
|---|---|---|---|
| Perez Socorro | -- | None Listed On Document | |
| Perez Socorro | -- | Corinthian Title Company | |
| Perez Socorro | -- | None Listed On Document | |
| Perez Leopoldo | -- | None Available | |
| Perez Leo | $231,000 | Continental Lawyers Title Co | |
| Mcmurray Bruce E | $237,500 | Continental Lawyers Title Co |
Source: Public Records
Mortgage History
| Date | Status | Borrower | Loan Amount |
|---|---|---|---|
| Open | Perez Socorro | $434,750 | |
| Closed | Perez Socorro | $434,750 | |
| Previous Owner | Perez Leo | $207,900 |
Source: Public Records
Tax History
| Year | Tax Paid | Tax Assessment Tax Assessment Total Assessment is a certain percentage of the fair market value that is determined by local assessors to be the total taxable value of land and additions on the property. | Land | Improvement |
|---|---|---|---|---|
| 2025 | $4,243 | $376,220 | $122,150 | $254,070 |
| 2024 | $4,109 | $368,843 | $119,755 | $249,088 |
| 2023 | $4,047 | $361,611 | $117,407 | $244,204 |
| 2022 | $3,959 | $354,521 | $115,105 | $239,416 |
| 2021 | $3,954 | $347,570 | $112,848 | $234,722 |
| 2020 | $3,846 | $344,006 | $111,691 | $232,315 |
| 2019 | $3,834 | $337,261 | $109,501 | $227,760 |
| 2018 | $3,742 | $330,648 | $107,354 | $223,294 |
| 2017 | $3,634 | $324,165 | $105,249 | $218,916 |
| 2016 | $3,432 | $317,809 | $103,185 | $214,624 |
| 2015 | $3,354 | $313,035 | $101,635 | $211,400 |
| 2014 | $3,268 | $306,903 | $99,644 | $207,259 |
Source: Public Records
Map
Nearby Homes
- 1844 N 1st Ave
- 1060 Pebble Beach Dr Unit 58
- 1238 Leggio Ln
- 256 W 18th St
- 1767 Seth Loop W
- 1695 N Palm Ave
- 1267 Kendra Ln
- 252 W 19th St
- 1629 N Palm Ave
- 689 E Cumberland St
- 2025 N 2nd Ave
- 1842 Richards Place
- 612 W 17th St
- 1499 Alta Ave
- 171 E 14th St
- 1405 E 15th St
- 1377 N 5th Ave
- 635 W 16th St
- 1623 N Vallejo Way
- 1526 Cole Ln
- 558 E Lureline Ct
- 592 E Lureline Ct
- 1746 Sunnybrook Ave
- 1743 Fernbrook Ave
- 1740 Sunnybrook Ave
- 598 E Lureline Ct
- 1747 Fernbrook Ave
- 579 E Lureline Ct
- 599 E Lureline Ct
- 559 E Lureline Ct
- 593 E Lureline Ct
- 1751 Sunnybrook Ave
- 1757 Sunnybrook Ave
- 1734 Sunnybrook Ave
- 1735 Fernbrook Ave
- 1745 Sunnybrook Ave
- 1765 Sunnybrook Ave
- 1778 Sunnybrook Ave
- 1744 Fernbrook Ave
- 1737 Sunnybrook Ave
Your Personal Tour Guide
Ask me questions while you tour the home.