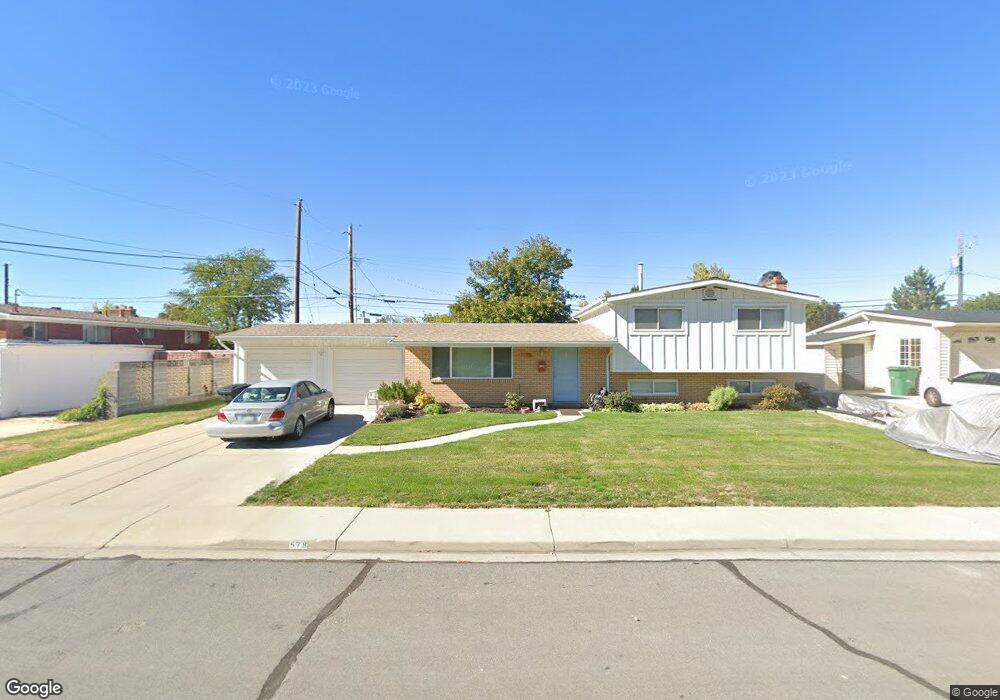
578 S 590 E Orem, UT 84097
SCERA NeighborhoodEstimated Value: $468,000 - $494,796
4
Beds
2
Baths
1,806
Sq Ft
$268/Sq Ft
Est. Value
About This Home
This home is located at 578 S 590 E, Orem, UT 84097 and is currently estimated at $484,265, approximately $268 per square foot. 578 S 590 E is a home located in Utah County with nearby schools including Centennial Elementary, Lakeridge Jr High School, and Orem High School.
Ownership History
Date
Name
Owned For
Owner Type
Purchase Details
Closed on
Feb 28, 2006
Sold by
Lefgren Lars J and Lefgren Kim D
Bought by
Wignall Karen R
Current Estimated Value
Home Financials for this Owner
Home Financials are based on the most recent Mortgage that was taken out on this home.
Original Mortgage
$160,000
Outstanding Balance
$89,729
Interest Rate
6.04%
Mortgage Type
Fannie Mae Freddie Mac
Estimated Equity
$394,536
Purchase Details
Closed on
Aug 1, 2001
Sold by
Sargent Jeffrey Scott and Sargent Ingela V
Bought by
Lefgren Lars J and Lefgren Kim D
Create a Home Valuation Report for This Property
The Home Valuation Report is an in-depth analysis detailing your home's value as well as a comparison with similar homes in the area
Home Values in the Area
Average Home Value in this Area
Purchase History
| Date | Buyer | Sale Price | Title Company |
|---|---|---|---|
| Wignall Karen R | -- | Mountain West Title Company | |
| Lefgren Lars J | -- | Sundance Title Insurance Age |
Source: Public Records
Mortgage History
| Date | Status | Borrower | Loan Amount |
|---|---|---|---|
| Open | Wignall Karen R | $160,000 |
Source: Public Records
Tax History
| Year | Tax Paid | Tax Assessment Tax Assessment Total Assessment is a certain percentage of the fair market value that is determined by local assessors to be the total taxable value of land and additions on the property. | Land | Improvement |
|---|---|---|---|---|
| 2025 | $1,742 | $229,020 | -- | -- |
| 2024 | $1,742 | $212,960 | $0 | $0 |
| 2023 | $1,607 | $211,200 | $0 | $0 |
| 2022 | $1,609 | $204,875 | $0 | $0 |
| 2021 | $1,488 | $287,000 | $133,000 | $154,000 |
| 2020 | $1,358 | $257,400 | $106,400 | $151,000 |
| 2019 | $1,270 | $250,300 | $99,300 | $151,000 |
| 2018 | $1,236 | $232,800 | $95,800 | $137,000 |
| 2017 | $1,195 | $120,505 | $0 | $0 |
| 2016 | $1,163 | $108,185 | $0 | $0 |
| 2015 | $1,230 | $108,185 | $0 | $0 |
| 2014 | $1,213 | $106,205 | $0 | $0 |
Source: Public Records
Map
Nearby Homes
Your Personal Tour Guide
Ask me questions while you tour the home.