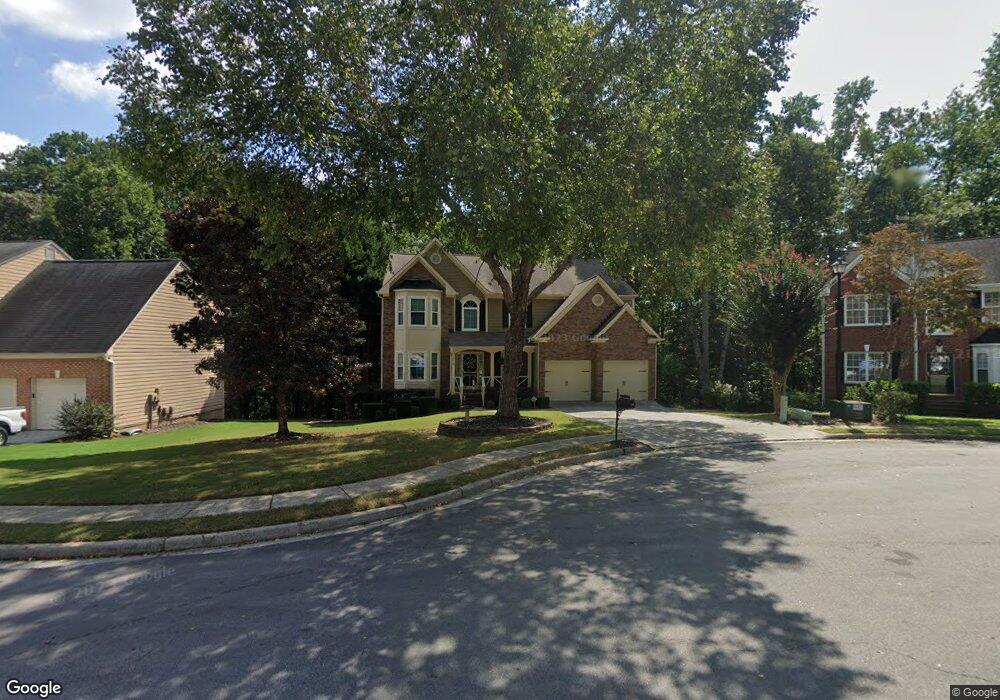
578 Staghorn Ct Suwanee, GA 30024
Estimated Value: $473,000 - $563,000
4
Beds
3
Baths
2,518
Sq Ft
$209/Sq Ft
Est. Value
About This Home
This home is located at 578 Staghorn Ct, Suwanee, GA 30024 and is currently estimated at $526,736, approximately $209 per square foot. 578 Staghorn Ct is a home located in Gwinnett County with nearby schools including Riverside Elementary School, North Gwinnett Middle School, and North Gwinnett High School.
Ownership History
Date
Name
Owned For
Owner Type
Purchase Details
Closed on
Feb 20, 2008
Sold by
Rasnick Jamey M
Bought by
Hinton Toby R and Hinton Suzanne M
Current Estimated Value
Home Financials for this Owner
Home Financials are based on the most recent Mortgage that was taken out on this home.
Original Mortgage
$174,100
Outstanding Balance
$106,324
Interest Rate
5.46%
Mortgage Type
New Conventional
Estimated Equity
$420,412
Purchase Details
Closed on
May 9, 2003
Sold by
Blackmon Donald
Bought by
Rasnick Jamey M
Home Financials for this Owner
Home Financials are based on the most recent Mortgage that was taken out on this home.
Original Mortgage
$202,250
Interest Rate
5.76%
Mortgage Type
New Conventional
Purchase Details
Closed on
Oct 3, 2002
Sold by
Blackmon Wonda-Nadirah
Bought by
Blackmon Donald
Purchase Details
Closed on
Dec 31, 1996
Sold by
G Torrey Atlanta S
Bought by
Blackman Donald
Create a Home Valuation Report for This Property
The Home Valuation Report is an in-depth analysis detailing your home's value as well as a comparison with similar homes in the area
Home Values in the Area
Average Home Value in this Area
Purchase History
| Date | Buyer | Sale Price | Title Company |
|---|---|---|---|
| Hinton Toby R | $217,700 | -- | |
| Rasnick Jamey M | $212,900 | -- | |
| Blackmon Donald | -- | -- | |
| Blackman Donald | $164,300 | -- |
Source: Public Records
Mortgage History
| Date | Status | Borrower | Loan Amount |
|---|---|---|---|
| Open | Hinton Toby R | $174,100 | |
| Previous Owner | Rasnick Jamey M | $202,250 | |
| Closed | Blackman Donald | $0 |
Source: Public Records
Tax History Compared to Growth
Tax History
| Year | Tax Paid | Tax Assessment Tax Assessment Total Assessment is a certain percentage of the fair market value that is determined by local assessors to be the total taxable value of land and additions on the property. | Land | Improvement |
|---|---|---|---|---|
| 2024 | $5,429 | $187,320 | $33,200 | $154,120 |
| 2023 | $5,429 | $187,320 | $33,200 | $154,120 |
| 2022 | $5,397 | $213,440 | $33,200 | $180,240 |
| 2021 | $4,186 | $125,600 | $20,000 | $105,600 |
| 2020 | $4,214 | $125,600 | $20,000 | $105,600 |
| 2019 | $3,593 | $140,880 | $20,000 | $120,880 |
| 2018 | $3,597 | $102,640 | $23,600 | $79,040 |
| 2016 | $3,457 | $95,268 | $20,060 | $75,208 |
| 2015 | $3,526 | $96,760 | $18,400 | $78,360 |
| 2014 | -- | $88,960 | $16,400 | $72,560 |
Source: Public Records
Map
Nearby Homes
- 570 White Stag Ct
- 1673 Harvest Park Ln
- 993 Harvest Park Ln
- 5105 Harbury Ln
- 285 Finsbury Park Ct Unit 2
- 811 Woodvale Point
- 1549 Bennett Creek Overlook
- 205 Finsbury Park Ct
- 790 Woodvale Point
- 487 Skiles Ct
- 4863 Rosemoore Ct
- 861 Woodvale Point
- 5004 Gunnison Trace
- 721 Woodvale Point
- 891 Woodvale Point
- 5224 Brendlynn Dr
- 5157 Wellisford Ct Unit 8
- 5195 Overbend Trail Unit 2
- 568 Staghorn Ct
- 588 Staghorn Ct
- 558 Staghorn Ct Unit 2
- 591 Staghorn Ct Unit 2
- 571 Staghorn Ct Unit 1
- 571 Staghorn Ct
- 561 Staghorn Ct Unit 56
- 561 Staghorn Ct
- 581 Staghorn Ct Unit 2
- 538 Staghorn Ct Unit 2
- 551 Staghorn Ct
- 0 Staghorn Ct Unit 8074519
- 0 Staghorn Ct Unit 7168185
- 0 Staghorn Ct
- 541 Staghorn Ct
- 528 Staghorn Ct Unit 2
- 560 White Stag Ct
- 550 White Stag Ct
- 540 White Stag Ct Unit 3
- 518 Staghorn Ct Unit 2