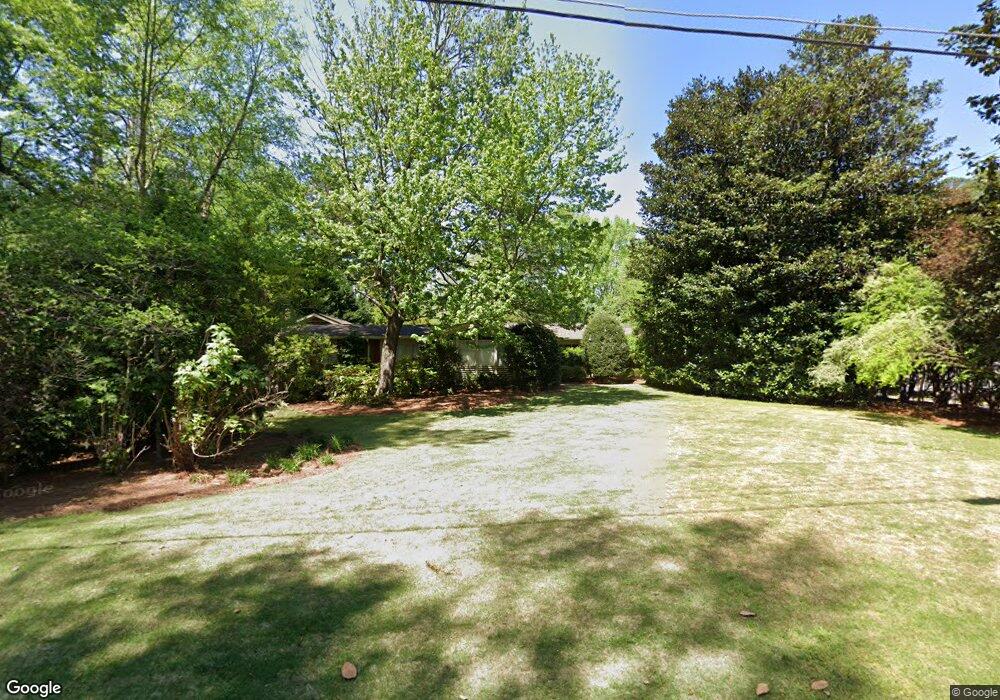
578 Walnut Dr SW Marietta, GA 30064
Southwestern Marietta NeighborhoodEstimated Value: $818,898 - $955,000
4
Beds
4
Baths
3,531
Sq Ft
$248/Sq Ft
Est. Value
About This Home
This home is located at 578 Walnut Dr SW, Marietta, GA 30064 and is currently estimated at $874,725, approximately $247 per square foot. 578 Walnut Dr SW is a home located in Cobb County with nearby schools including Hickory Hills Elementary School, Marietta Sixth Grade Academy, and Marietta Middle School.
Ownership History
Date
Name
Owned For
Owner Type
Purchase Details
Closed on
Mar 28, 2011
Sold by
Vetter Moira
Bought by
Vetter Moira and Watson Jennifer
Current Estimated Value
Purchase Details
Closed on
Sep 30, 2010
Sold by
Pagan Elba N
Bought by
Vetter Moira
Home Financials for this Owner
Home Financials are based on the most recent Mortgage that was taken out on this home.
Original Mortgage
$368,000
Interest Rate
4.42%
Mortgage Type
New Conventional
Purchase Details
Closed on
Sep 12, 2005
Sold by
Hale Stephen W and Hale Judith
Bought by
Pagan Elba N
Home Financials for this Owner
Home Financials are based on the most recent Mortgage that was taken out on this home.
Original Mortgage
$409,600
Interest Rate
5.77%
Mortgage Type
New Conventional
Purchase Details
Closed on
Nov 17, 2000
Sold by
Halpern Terry B
Bought by
Hale Stephen W and Hale Judith A
Home Financials for this Owner
Home Financials are based on the most recent Mortgage that was taken out on this home.
Original Mortgage
$265,000
Interest Rate
7.87%
Mortgage Type
New Conventional
Create a Home Valuation Report for This Property
The Home Valuation Report is an in-depth analysis detailing your home's value as well as a comparison with similar homes in the area
Home Values in the Area
Average Home Value in this Area
Purchase History
| Date | Buyer | Sale Price | Title Company |
|---|---|---|---|
| Vetter Moira | -- | -- | |
| Vetter Moira | $475,000 | -- | |
| Pagan Elba N | $512,000 | -- | |
| Hale Stephen W | $415,000 | -- |
Source: Public Records
Mortgage History
| Date | Status | Borrower | Loan Amount |
|---|---|---|---|
| Previous Owner | Vetter Moira | $368,000 | |
| Previous Owner | Pagan Elba N | $409,600 | |
| Previous Owner | Hale Stephen W | $265,000 |
Source: Public Records
Tax History Compared to Growth
Tax History
| Year | Tax Paid | Tax Assessment Tax Assessment Total Assessment is a certain percentage of the fair market value that is determined by local assessors to be the total taxable value of land and additions on the property. | Land | Improvement |
|---|---|---|---|---|
| 2025 | $2,933 | $346,736 | $98,000 | $248,736 |
| 2024 | $2,933 | $346,736 | $98,000 | $248,736 |
| 2023 | $2,440 | $288,416 | $88,000 | $200,416 |
| 2022 | $1,875 | $221,596 | $87,000 | $134,596 |
| 2021 | $1,904 | $221,596 | $87,000 | $134,596 |
| 2020 | $1,826 | $212,560 | $67,000 | $145,560 |
| 2019 | $1,792 | $208,560 | $63,000 | $145,560 |
| 2018 | $1,669 | $194,292 | $60,000 | $134,292 |
| 2017 | $1,395 | $202,520 | $46,000 | $156,520 |
| 2016 | $1,395 | $202,520 | $46,000 | $156,520 |
| 2015 | $1,292 | $172,268 | $46,000 | $126,268 |
| 2014 | $1,335 | $172,268 | $0 | $0 |
Source: Public Records
Map
Nearby Homes
- 305 Brookwood Dr SW
- 563 Hillandale Cir SW
- 916 Cannongate Crossing SW Unit 916
- 916 Cannon Gate Crossing
- 873 Cavalry Dr SW
- 798 Sentinel Ridge SW
- 838 Cannon Run SW
- 1011 Cannongate Crossing SW
- 1017 Cannongate Crossing SW
- 834 Cannon Run SW
- 199 Brookwood Dr SW
- 1121 Cannongate Crossing SW
- 839 Manning Villas Ct SW
- 681 Hampton Place SW
- 479 Banks St SW
- 260 Manning Rd SW Unit 110
- 662 Bouldercrest Dr SW
- 556 Walnut Dr SW
- 602 Walnut Dr SW
- 350 Kirkpatrick Dr SW Unit 2
- 579 Walnut Dr SW
- 544 Walnut Dr SW
- 347 Kirkpatrick Dr SW
- 595 Walnut Dr SW
- 557 Walnut Dr SW
- 612 Walnut Dr SW
- 0 Walnut Dr Unit 7352498
- 0 Walnut Dr Unit 7062542
- 0 Walnut Dr Unit 7611174
- 0 Walnut Dr Unit 7606100
- 0 Walnut Dr Unit 8386175
- 607 Walnut Dr SW
- 543 Walnut Dr SW
- 634 Walnut Dr SW
- 440 Woodvalley Dr SW
- 623 Walnut Dr SW
- 441 Woodvalley Dr SW