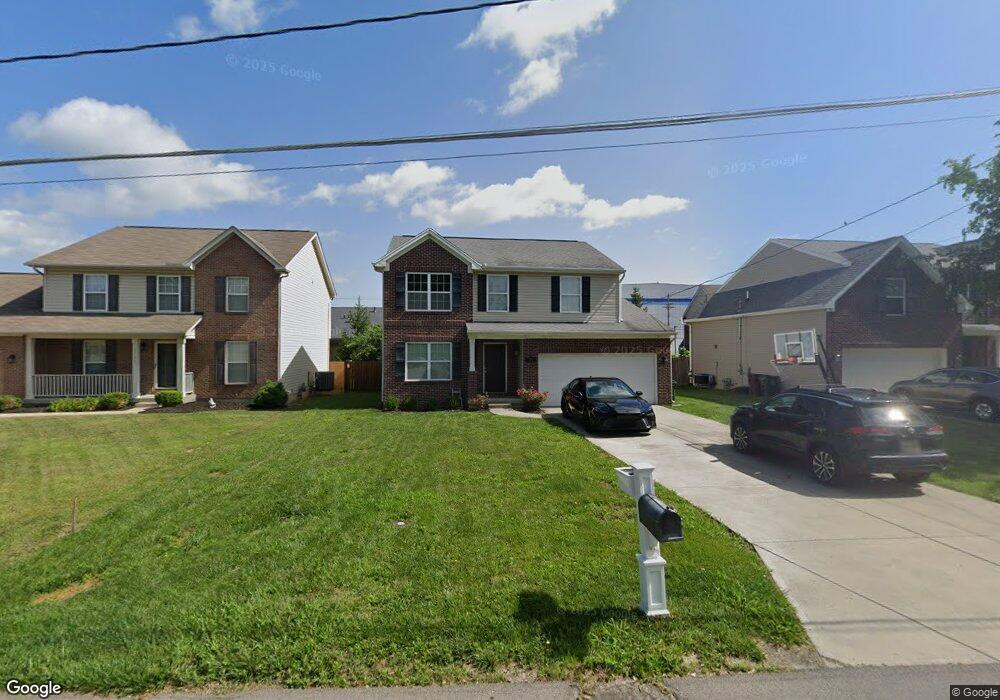
5780 Florence Ave Cincinnati, OH 45242
Estimated Value: $408,714 - $484,000
4
Beds
3
Baths
2,004
Sq Ft
$222/Sq Ft
Est. Value
About This Home
This home is located at 5780 Florence Ave, Cincinnati, OH 45242 and is currently estimated at $444,179, approximately $221 per square foot. 5780 Florence Ave is a home located in Hamilton County with nearby schools including Edwin H Greene Intermediate Middle School, Sycamore Junior High School, and Sycamore High School.
Ownership History
Date
Name
Owned For
Owner Type
Purchase Details
Closed on
Jul 19, 2011
Sold by
Pernice Chris
Bought by
Isaacs Jennifer L and Isaacs Bryan
Current Estimated Value
Home Financials for this Owner
Home Financials are based on the most recent Mortgage that was taken out on this home.
Original Mortgage
$185,183
Outstanding Balance
$127,340
Interest Rate
4.5%
Mortgage Type
FHA
Estimated Equity
$316,839
Purchase Details
Closed on
Sep 7, 2010
Sold by
Post James H
Bought by
Pernice Chris
Purchase Details
Closed on
Feb 11, 2008
Sold by
Post John H and Post Kimberly A
Bought by
Post James H
Home Financials for this Owner
Home Financials are based on the most recent Mortgage that was taken out on this home.
Original Mortgage
$182,705
Interest Rate
5.75%
Mortgage Type
Unknown
Purchase Details
Closed on
Feb 4, 2006
Sold by
Post John H and Post Kimberly A
Bought by
Post John H
Create a Home Valuation Report for This Property
The Home Valuation Report is an in-depth analysis detailing your home's value as well as a comparison with similar homes in the area
Home Values in the Area
Average Home Value in this Area
Purchase History
| Date | Buyer | Sale Price | Title Company |
|---|---|---|---|
| Isaacs Jennifer L | $190,000 | Attorney | |
| Pernice Chris | $30,000 | Attorney | |
| Post James H | $90,047 | Attorney | |
| Post John H | -- | None Available |
Source: Public Records
Mortgage History
| Date | Status | Borrower | Loan Amount |
|---|---|---|---|
| Open | Isaacs Jennifer L | $185,183 | |
| Previous Owner | Post James H | $182,705 |
Source: Public Records
Tax History Compared to Growth
Tax History
| Year | Tax Paid | Tax Assessment Tax Assessment Total Assessment is a certain percentage of the fair market value that is determined by local assessors to be the total taxable value of land and additions on the property. | Land | Improvement |
|---|---|---|---|---|
| 2024 | $4,617 | $109,099 | $14,767 | $94,332 |
| 2023 | $4,640 | $109,099 | $14,767 | $94,332 |
| 2022 | $3,922 | $76,675 | $7,578 | $69,097 |
| 2021 | $3,839 | $76,675 | $7,578 | $69,097 |
| 2020 | $3,869 | $76,675 | $7,578 | $69,097 |
| 2019 | $3,305 | $60,376 | $5,968 | $54,408 |
| 2018 | $3,164 | $60,376 | $5,968 | $54,408 |
| 2017 | $2,968 | $60,376 | $5,968 | $54,408 |
| 2016 | $3,147 | $61,845 | $9,765 | $52,080 |
| 2015 | $2,776 | $61,845 | $9,765 | $52,080 |
| 2014 | $2,786 | $61,845 | $9,765 | $52,080 |
| 2013 | $3,081 | $66,500 | $10,500 | $56,000 |
Source: Public Records
Map
Nearby Homes
- 11117 Kemper Ave
- 11167 Labelle Ave
- 11192 Jardin Place
- 7379 Cornell Rd
- 8030 Deershadow Ln
- 11215 Gideon Ln
- OAK HILL Plan at Sycamore Woods
- BEDFORD Plan at Sycamore Woods
- CRESTWOOD Plan at Sycamore Woods
- SEBASTIAN Plan at Sycamore Woods
- ASH LAWN Plan at Sycamore Woods
- BENNETT Plan at Sycamore Woods
- BRENNAN Plan at Sycamore Woods
- VANDERBURGH Plan at Sycamore Woods
- LYNDHURST Plan at Sycamore Woods
- 11309 Gideon Ln
- 10856 Lake Thames Dr Unit 167
- 4170 Cornell Rd
- 10816 Lakehurst Ct
- 10820 Lakehurst Ct
- 5830 Florence Ave
- 5750 Florence Ave
- 5860 Florence Ave
- 5700 Florence Ave
- 11168 Oak Ave
- 11164 Oak Ave
- 5769 Florence Ave
- 11160 Oak Ave
- 5869 Cornell Rd
- 5655 Florence Ave
- 11145 Oak Ave
- 11155 Centennial Ave
- 11156 Oak Ave
- 7 Cornell Rd
- 1 Cornell Rd Unit 1
- 6 Cornell Rd Unit 6
- 7 Cornell Rd Unit 7
- 2 Cornell Rd Unit 2
- 3 Cornell Rd Unit 3
- 1016 Cornell Rd