5781 N Rogers Ave Chicago, IL 60646
Sauganash NeighborhoodEstimated Value: $505,000 - $648,000
3
Beds
2
Baths
1,559
Sq Ft
$364/Sq Ft
Est. Value
About This Home
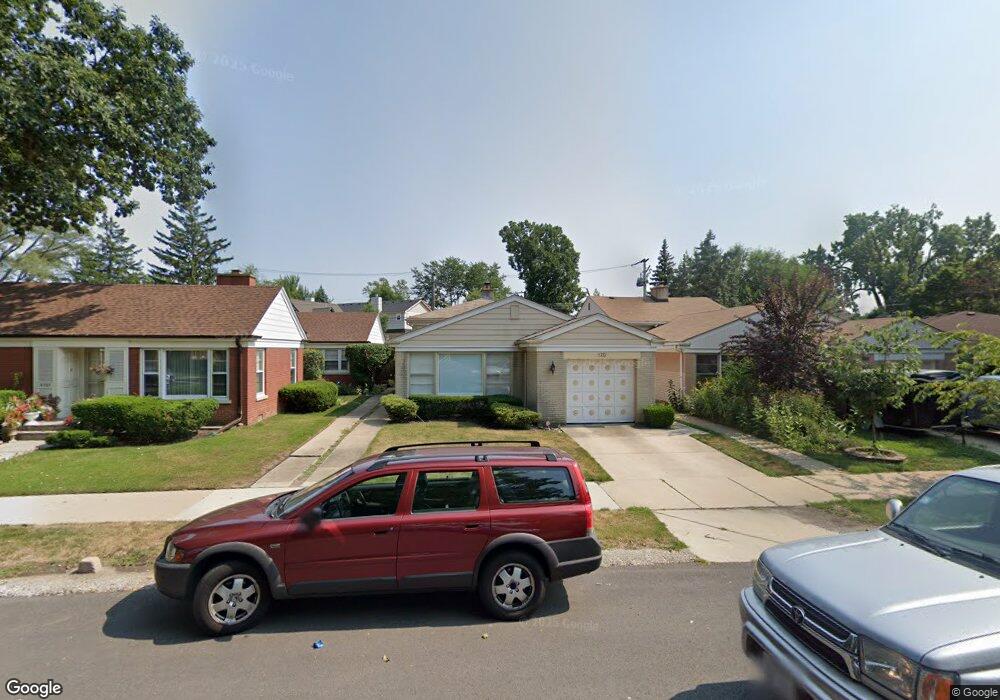
This home is located at 5781 N Rogers Ave, Chicago, IL 60646 and is currently estimated at $567,844, approximately $364 per square foot. 5781 N Rogers Ave is a home located in Cook County with nearby schools including Sauganash Elementary School, William Howard Taft High School, and CICS Northtown.
Ownership History
Date
Name
Owned For
Owner Type
Purchase Details
Closed on
Sep 28, 2011
Sold by
Goodwin Catherine
Bought by
Goodwin Amy E
Current Estimated Value
Home Financials for this Owner
Home Financials are based on the most recent Mortgage that was taken out on this home.
Original Mortgage
$148,000
Outstanding Balance
$99,058
Interest Rate
4.02%
Mortgage Type
New Conventional
Estimated Equity
$468,786
Purchase Details
Closed on
Feb 10, 2010
Sold by
Vonnemeth Elizabeth and Von Nemeth Goodwin Catherine
Bought by
Vonnemeth Elizabeth
Purchase Details
Closed on
Jun 6, 2009
Sold by
Vonnemeth Elizabeth
Bought by
Nemeth Vonnemeth Elizabeth and Nemeth Goodwin Catherine Von
Purchase Details
Closed on
Mar 25, 2004
Sold by
Vonnemeth Josef and Vonnemeth Elizabeth
Bought by
Vonnemeth Josef and Vonnemeth Elizabeth
Purchase Details
Closed on
Feb 13, 2002
Sold by
Lasalle Bank National Assn
Bought by
Vonnemeth Josef and Vonnemeth Elizabeth
Create a Home Valuation Report for This Property
The Home Valuation Report is an in-depth analysis detailing your home's value as well as a comparison with similar homes in the area
Home Values in the Area
Average Home Value in this Area
Purchase History
| Date | Buyer | Sale Price | Title Company |
|---|---|---|---|
| Goodwin Amy E | -- | Republic Title Co | |
| Vonnemeth Elizabeth | -- | None Available | |
| Nemeth Vonnemeth Elizabeth | -- | Marathon Title Co | |
| Vonnemeth Josef | -- | -- | |
| Vonnemeth Josef | -- | -- |
Source: Public Records
Mortgage History
| Date | Status | Borrower | Loan Amount |
|---|---|---|---|
| Open | Goodwin Amy E | $148,000 |
Source: Public Records
Tax History
| Year | Tax Paid | Tax Assessment Tax Assessment Total Assessment is a certain percentage of the fair market value that is determined by local assessors to be the total taxable value of land and additions on the property. | Land | Improvement |
|---|---|---|---|---|
| 2025 | $8,662 | $47,581 | $14,530 | $33,051 |
| 2024 | $8,662 | $47,581 | $14,530 | $33,051 |
| 2023 | $8,582 | $44,224 | $11,718 | $32,506 |
| 2022 | $8,582 | $45,001 | $11,718 | $33,283 |
| 2021 | $8,407 | $44,999 | $11,717 | $33,282 |
| 2020 | $7,370 | $36,073 | $7,499 | $28,574 |
| 2019 | $7,389 | $40,082 | $7,499 | $32,583 |
| 2018 | $8,002 | $43,812 | $7,499 | $36,313 |
| 2017 | $5,981 | $31,068 | $6,561 | $24,507 |
| 2016 | $5,742 | $31,068 | $6,561 | $24,507 |
| 2015 | $5,231 | $31,068 | $6,561 | $24,507 |
| 2014 | $5,490 | $32,049 | $5,624 | $26,425 |
| 2013 | $5,719 | $33,961 | $5,624 | $28,337 |
Source: Public Records
Map
Nearby Homes
- 5842 N Saint Johns Ct
- 5635 N Kostner Ave
- 4323 W Peterson Ave
- 5630 N Kenton Ave
- 4228 W Harrington Ln
- 5710 N Karlov Ave
- 6101 N Knox Ave
- 5711 N Karlov Ave
- 6128 N Kildare Ave
- 6056 N Keeler Ave
- 5932 N Keating Ave
- 6148 N Lowell Ave
- 5340 N Lowell Ave Unit 208
- 6228 N Forest Glen Ave
- 6247 N Kilpatrick Ave
- 6227 N Sauganash Ave
- 6000 N Cicero Ave Unit 410
- 6000 N Cicero Ave Unit 301
- 6149 N Karlov Ave
- 5787 N Clifford Ave
- 5777 N Rogers Ave
- 5785 N Rogers Ave
- 5785 N Rogers Ave
- 5737 N Kenneth Ave
- 5789 N Rogers Ave
- 5789 N Rogers Ave
- 5721 N Kenneth Ave
- 5793 N Rogers Ave
- 5734 N Kostner Ave
- 5728 N Kostner Ave
- 5730 N Kostner Ave
- 5726 N Kostner Ave
- 5800 N Kenneth Ave
- 5800 N Kenneth Ave
- 5800 N Kenneth Ave
- 5719 N Kenneth Ave
- 5722 N Kostner Ave
- 5799 N Rogers Ave
- 5770 N Rogers Ave
- 5801 N Kenneth Ave
Your Personal Tour Guide
Ask me questions while you tour the home.