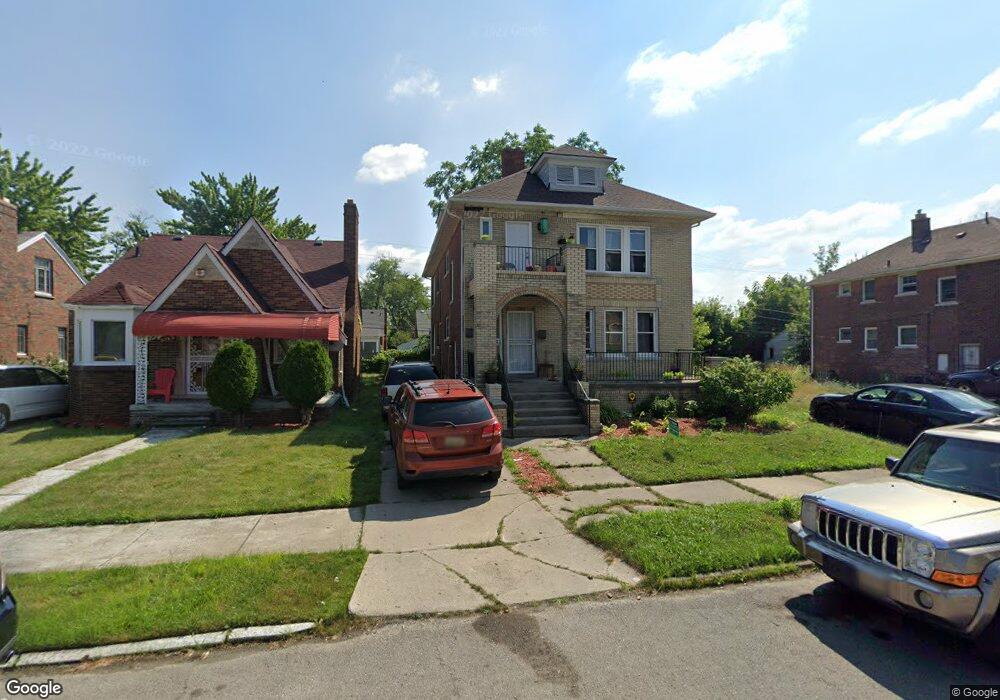
5782 Chatsworth St Detroit, MI 48224
Morningside NeighborhoodEstimated Value: $146,000 - $217,000
6
Beds
3
Baths
2,600
Sq Ft
$65/Sq Ft
Est. Value
About This Home
This home is located at 5782 Chatsworth St, Detroit, MI 48224 and is currently estimated at $170,196, approximately $65 per square foot. 5782 Chatsworth St is a home located in Wayne County with nearby schools including Ronald Brown Academy, Edward 'Duke' Ellington Conservatory of Music and Art, and Charles L. Spain Elementary-Middle School.
Ownership History
Date
Name
Owned For
Owner Type
Purchase Details
Closed on
Nov 4, 2021
Sold by
Renaissance Village Inc
Bought by
Jozovich Marianne and Oconnell Erin
Current Estimated Value
Purchase Details
Closed on
Jan 25, 2018
Sold by
The Detroit Land Bank Authority
Bought by
Renaissance Village
Purchase Details
Closed on
Aug 17, 2012
Sold by
Wayne County Treasurer
Bought by
Cooper Beverly G
Purchase Details
Closed on
Nov 4, 2007
Sold by
Las Olas Acquisition Partners Llc
Bought by
Golden Anthony
Purchase Details
Closed on
Oct 12, 2007
Sold by
American Residential Equities Xxxiv Llc
Bought by
Las Olas Acquisition Partners Llc
Purchase Details
Closed on
Mar 22, 2007
Sold by
Moses George
Bought by
Gmac Mortgage Llc
Purchase Details
Closed on
May 31, 2006
Sold by
Manning Stephen
Bought by
Moses George
Purchase Details
Closed on
Aug 26, 2005
Sold by
Lareau Monique M
Bought by
Manning Stephen
Create a Home Valuation Report for This Property
The Home Valuation Report is an in-depth analysis detailing your home's value as well as a comparison with similar homes in the area
Home Values in the Area
Average Home Value in this Area
Purchase History
| Date | Buyer | Sale Price | Title Company |
|---|---|---|---|
| Jozovich Marianne | -- | None Available | |
| Renaissance Village | $4,700 | None Available | |
| Cooper Beverly G | $600 | None Available | |
| Golden Anthony | $84,500 | None Available | |
| Las Olas Acquisition Partners Llc | -- | None Available | |
| Gmac Mortgage Llc | $114,234 | None Available | |
| Moses George | $127,000 | Metro Title Corp | |
| Manning Stephen | $81,000 | Minnesota Title Agency |
Source: Public Records
Tax History Compared to Growth
Tax History
| Year | Tax Paid | Tax Assessment Tax Assessment Total Assessment is a certain percentage of the fair market value that is determined by local assessors to be the total taxable value of land and additions on the property. | Land | Improvement |
|---|---|---|---|---|
| 2025 | $648 | $11,800 | $0 | $0 |
| 2024 | $648 | $9,200 | $0 | $0 |
| 2023 | $874 | $6,935 | $0 | $0 |
| 2022 | $1,681 | $24,200 | $0 | $0 |
| 2021 | $1,495 | $20,300 | $0 | $0 |
| 2020 | $1,494 | $18,800 | $0 | $0 |
| 2019 | $1,473 | $12,800 | $0 | $0 |
| 2018 | $340 | $11,300 | $0 | $0 |
| 2017 | $199 | $10,500 | $0 | $0 |
| 2016 | $1,514 | $15,500 | $0 | $0 |
| 2015 | $1,550 | $15,500 | $0 | $0 |
| 2013 | $2,087 | $20,872 | $0 | $0 |
| 2010 | -- | $30,601 | $1,175 | $29,426 |
Source: Public Records
Map
Nearby Homes
- 5767 Berkshire St
- 5752 Chatsworth St
- 5743 Buckingham Ave
- 5727 Buckingham Ave
- 5719 Haverhill St
- 5585 Buckingham Ave
- 5934 Haverhill St
- 5574 Buckingham Ave
- 5544 Balfour Rd
- 5761 Devonshire Rd
- 5920 Nottingham Rd
- 5566 Somerset Ave
- 5535 Balfour Rd
- 15837 Evanston St
- 15925 Evanston St
- 9205 Mckinney St
- 5511 Somerset Ave
- 5511 Devonshire Rd
- 9300 Mckinney St
- 9316 Mckinney St
- 5774 Chatsworth St
- 5790 Chatsworth St
- 5768 Chatsworth St
- 5800 Chatsworth St
- 5785 Berkshire St
- 5760 Chatsworth St
- 5810 Chatsworth St
- 5775 Berkshire St
- 5793 Berkshire St
- 5801 Berkshire St
- 5761 Berkshire St
- 5807 Berkshire St
- 5785 Chatsworth St
- 5785 Chatsworth St
- 5793 Chatsworth St
- 5777 Chatsworth St Unit Bldg-Unit
- 5777 Chatsworth St
- 5755 Berkshire St
- 5801 Chatsworth St
- 5746 Chatsworth St