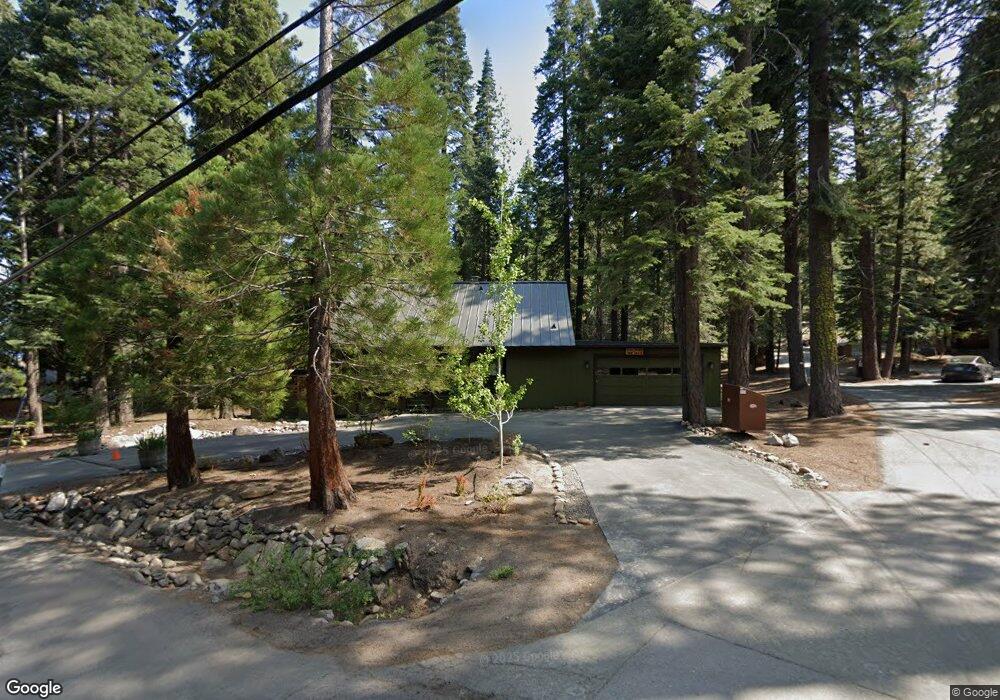
5784 Ophir St Carnelian Bay, CA 96140
Estimated Value: $916,000 - $1,036,000
3
Beds
2
Baths
1,332
Sq Ft
$736/Sq Ft
Est. Value
About This Home
This home is located at 5784 Ophir St, Carnelian Bay, CA 96140 and is currently estimated at $980,483, approximately $736 per square foot. 5784 Ophir St is a home with nearby schools including Kings Beach Elementary School, North Tahoe School, and North Tahoe High School.
Ownership History
Date
Name
Owned For
Owner Type
Purchase Details
Closed on
Apr 22, 2019
Sold by
Peterson Lisa Marie Campbell and Peterson John W
Bought by
Peterson Lisa Marie Campbell and Peterson John W
Current Estimated Value
Purchase Details
Closed on
Aug 11, 2016
Sold by
Campbell Campbell Kathleen L Kathleen L and Campbell Stewart Lynne
Bought by
Peterson Lisa Marie Campbell and Peterson John W
Purchase Details
Closed on
Nov 19, 2010
Sold by
Campbell Campbell Michael R Michael R
Bought by
Campbell Campbell Kathleen L Kathleen L and Campbell Stewart Lynne
Purchase Details
Closed on
Feb 22, 1999
Sold by
Campbell C R & Muriel L Revocable Living
Bought by
Campbell Muriel L R
Purchase Details
Closed on
Feb 24, 1995
Sold by
Taylor Gary W and Taylor Paula M
Bought by
Taylor Gary W and Taylor Paula M
Purchase Details
Closed on
Sep 8, 1994
Sold by
Smith Gilman L
Bought by
Taylor Gary W and Taylor Paula M
Create a Home Valuation Report for This Property
The Home Valuation Report is an in-depth analysis detailing your home's value as well as a comparison with similar homes in the area
Home Values in the Area
Average Home Value in this Area
Purchase History
| Date | Buyer | Sale Price | Title Company |
|---|---|---|---|
| Peterson Lisa Marie Campbell | -- | None Available | |
| Peterson Lisa Marie Campbell | -- | Fidelity National Title Co | |
| Campbell Campbell Kathleen L Kathleen L | -- | None Available | |
| Campbell Muriel L R | -- | -- | |
| Taylor Gary W | -- | -- | |
| Taylor Gary W | $245,000 | First American Title Company |
Source: Public Records
Tax History Compared to Growth
Tax History
| Year | Tax Paid | Tax Assessment Tax Assessment Total Assessment is a certain percentage of the fair market value that is determined by local assessors to be the total taxable value of land and additions on the property. | Land | Improvement |
|---|---|---|---|---|
| 2025 | $5,132 | $388,788 | $117,139 | $271,649 |
| 2023 | $5,132 | $373,693 | $112,592 | $261,101 |
| 2022 | $4,879 | $366,367 | $110,385 | $255,982 |
| 2021 | $4,710 | $359,184 | $108,221 | $250,963 |
| 2020 | $4,705 | $355,502 | $107,112 | $248,390 |
| 2019 | $4,742 | $348,532 | $105,012 | $243,520 |
| 2018 | $4,311 | $341,699 | $102,953 | $238,746 |
| 2017 | $4,725 | $379,999 | $123,435 | $256,564 |
| 2016 | $3,199 | $240,194 | $42,887 | $197,307 |
| 2015 | $3,136 | $236,587 | $42,243 | $194,344 |
| 2014 | $3,050 | $231,954 | $41,416 | $190,538 |
Source: Public Records
Map
Nearby Homes
- 5783 N Lake Blvd
- 5768 N Lake Blvd
- 5820 Dodowah Rd
- 5999 N Lake Blvd
- 5695 Uplands Rd
- 5775 Victoria Dr
- 6061 N Lake Blvd
- 573 Granite Rd
- 5899 Sudan Rd
- 6099 Dodowah Rd
- 5554 N Lake Blvd
- 200 Rim Dr
- 5393 N Lake Blvd
- 5671 N Lake Blvd Unit Nile Road
- 5255 N Lake Blvd
- 200 Estates Dr
- 5101 N Lake Blvd Unit 68
- 5101 N Lake Blvd Unit 130
- 5101 N Lake Blvd Unit 48
- 5101 N Lake Blvd Unit 60