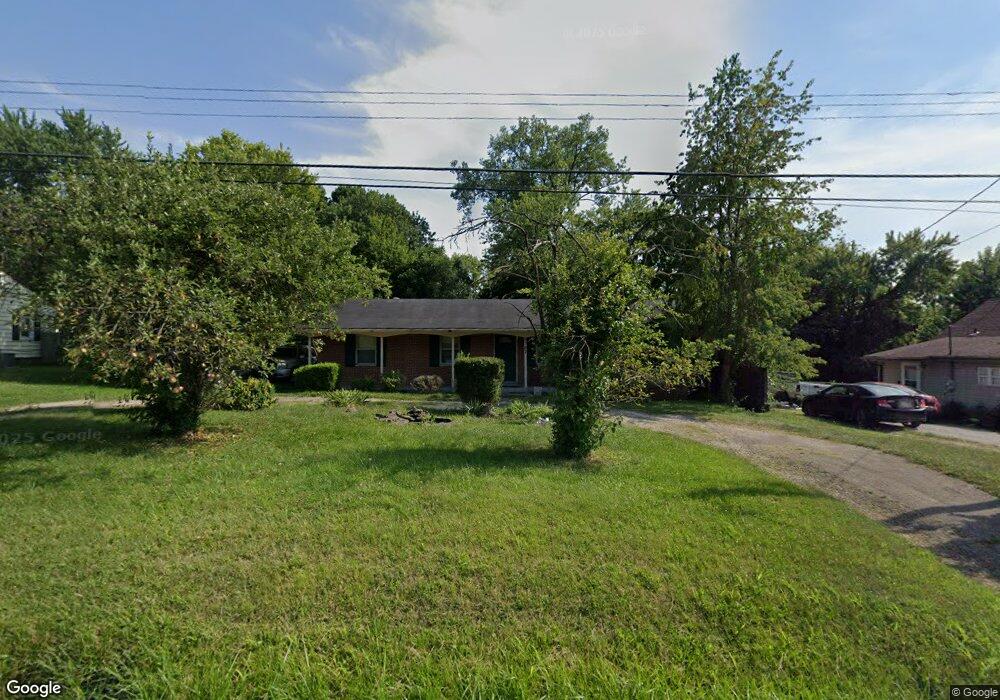
5787 Manchester Rd Franklin, OH 45005
Estimated Value: $201,000 - $236,000
3
Beds
1
Bath
1,274
Sq Ft
$175/Sq Ft
Est. Value
About This Home
This home is located at 5787 Manchester Rd, Franklin, OH 45005 and is currently estimated at $223,256, approximately $175 per square foot. 5787 Manchester Rd is a home located in Warren County with nearby schools including Franklin High School, Summit Academy Community School for Alternative Learners - Middletown, and Summit Academy Secondary School - Middletown.
Ownership History
Date
Name
Owned For
Owner Type
Purchase Details
Closed on
May 13, 1998
Sold by
Morrissey April
Bought by
Hale Timothy S
Current Estimated Value
Home Financials for this Owner
Home Financials are based on the most recent Mortgage that was taken out on this home.
Original Mortgage
$80,317
Outstanding Balance
$15,899
Interest Rate
7.25%
Mortgage Type
FHA
Estimated Equity
$207,357
Purchase Details
Closed on
Oct 3, 1995
Sold by
Powell Dennis M
Bought by
Morrissey Robert K
Home Financials for this Owner
Home Financials are based on the most recent Mortgage that was taken out on this home.
Original Mortgage
$63,005
Interest Rate
7.63%
Mortgage Type
New Conventional
Purchase Details
Closed on
Jul 7, 1988
Sold by
Smith Cron and Smith Anna
Bought by
Powell and Powell Dennis M
Purchase Details
Closed on
Jan 11, 1980
Sold by
Akers Akers and Akers Edward Darrell
Create a Home Valuation Report for This Property
The Home Valuation Report is an in-depth analysis detailing your home's value as well as a comparison with similar homes in the area
Home Values in the Area
Average Home Value in this Area
Purchase History
| Date | Buyer | Sale Price | Title Company |
|---|---|---|---|
| Hale Timothy S | $81,200 | -- | |
| Morrissey Robert K | $64,000 | -- | |
| Powell | $36,500 | -- | |
| -- | $40,000 | -- |
Source: Public Records
Mortgage History
| Date | Status | Borrower | Loan Amount |
|---|---|---|---|
| Open | Hale Timothy S | $80,317 | |
| Previous Owner | Morrissey Robert K | $63,005 |
Source: Public Records
Tax History Compared to Growth
Tax History
| Year | Tax Paid | Tax Assessment Tax Assessment Total Assessment is a certain percentage of the fair market value that is determined by local assessors to be the total taxable value of land and additions on the property. | Land | Improvement |
|---|---|---|---|---|
| 2024 | $2,380 | $52,740 | $15,080 | $37,660 |
| 2023 | $2,005 | $40,012 | $7,910 | $32,102 |
| 2022 | $1,960 | $40,012 | $7,910 | $32,102 |
| 2021 | $1,850 | $40,012 | $7,910 | $32,102 |
| 2020 | $1,782 | $33,908 | $6,703 | $27,206 |
| 2019 | $1,613 | $33,908 | $6,703 | $27,206 |
| 2018 | $1,605 | $33,908 | $6,703 | $27,206 |
| 2017 | $1,562 | $29,848 | $5,985 | $23,863 |
| 2016 | $1,559 | $29,848 | $5,985 | $23,863 |
| 2015 | $1,559 | $29,848 | $5,985 | $23,863 |
| 2014 | $1,605 | $29,850 | $5,990 | $23,860 |
| 2013 | $1,355 | $33,420 | $6,700 | $26,720 |
Source: Public Records
Map
Nearby Homes
- 5845 Manchester Rd
- 5756 Union Rd
- 25 Timber Creek Dr
- 220 Pleasant Hill Blvd
- 60 Pleasant Hill Blvd
- 5696 Woodcreek Dr
- 5667 Woodcreek Dr
- 4640 Shaker Rd
- 6777 Crystal Harbour Dr
- 5714 Millbrook Dr
- 6795 Crystal Harbour Dr
- 5760 Autumn Dr
- 6772 Rivulet Dr
- 5031 Gerber Dr
- 5019 Waterford Ln
- Creekside Paired Villa Plan at Waterford Place
- 4821 Manchester Rd
- 4964 Timberline Dr Unit 81
- 4840 Shannon Way
- 5771 Manchester Rd
- 5801 Manchester Rd
- 5772 Lynn St
- 5815 Manchester Rd
- 5788 Lynn St
- 5758 Lynn St
- 5758 Manchester Rd
- 5744 Lynn St
- 5802 Lynn St
- 5745 Manchester Rd
- 5825 Manchester Rd
- 5452 Hinton St
- 5728 Lynn St
- 5731 Manchester Rd
- 5828 Manchester Rd
- 5771 Lynn St
- 5716 Lynn St
- 5757 Lynn St
- 5801 Lynn St
- 5743 Lynn St