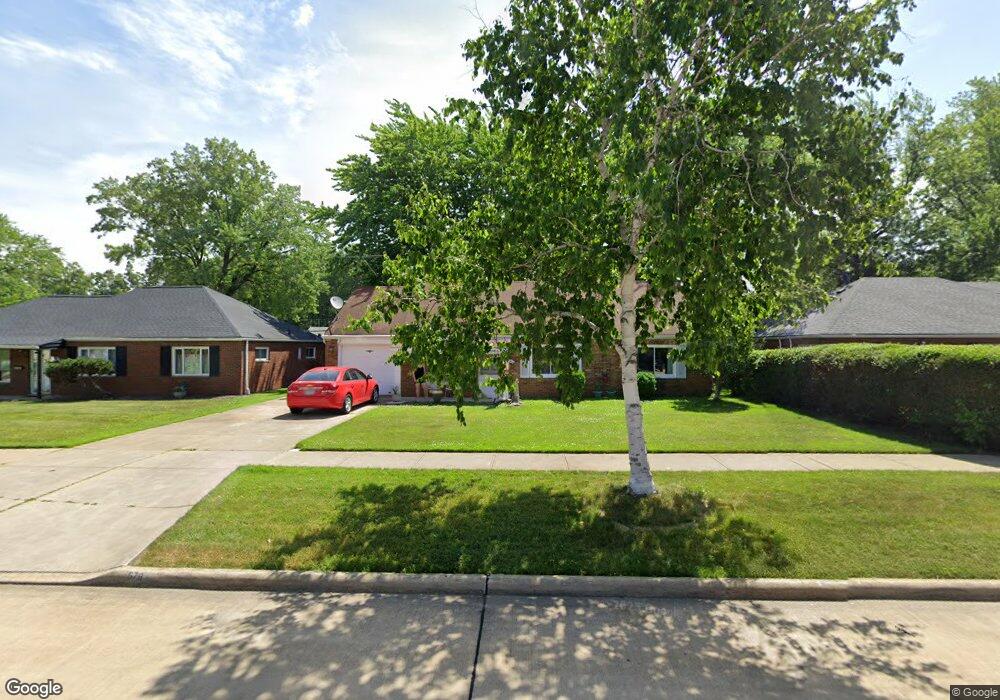
579 Birch Ave Euclid, OH 44132
Estimated Value: $177,579 - $188,000
3
Beds
2
Baths
1,593
Sq Ft
$115/Sq Ft
Est. Value
About This Home
This home is located at 579 Birch Ave, Euclid, OH 44132 and is currently estimated at $183,145, approximately $114 per square foot. 579 Birch Ave is a home located in Cuyahoga County with nearby schools including Shoreview Elementary School, Euclid High School, and Pinnacle Academy.
Ownership History
Date
Name
Owned For
Owner Type
Purchase Details
Closed on
Mar 30, 2000
Sold by
Will Of Frank J Dowdell and Marvin F
Bought by
Thompson Bruce W and Thompson Margaret M
Current Estimated Value
Home Financials for this Owner
Home Financials are based on the most recent Mortgage that was taken out on this home.
Original Mortgage
$94,223
Outstanding Balance
$29,493
Interest Rate
8.31%
Mortgage Type
FHA
Estimated Equity
$153,652
Purchase Details
Closed on
Mar 29, 1994
Sold by
Dowdell Frank J
Bought by
Dowdell Frank J
Purchase Details
Closed on
May 22, 1985
Sold by
Robert C Ruggerio
Bought by
Dowdell Frank J
Purchase Details
Closed on
Apr 7, 1981
Sold by
Ruggerio Robt C
Bought by
Robert C Ruggerio
Purchase Details
Closed on
Jan 1, 1975
Bought by
Ruggerio Robt C
Create a Home Valuation Report for This Property
The Home Valuation Report is an in-depth analysis detailing your home's value as well as a comparison with similar homes in the area
Home Values in the Area
Average Home Value in this Area
Purchase History
We collect this data history from publicly available records. To have your information removed, we recommend requesting removal directly through your county’s website.
| Date | Buyer | Sale Price | Title Company |
|---|---|---|---|
| Thompson Bruce W | $95,000 | Pro Title Agency Inc | |
| Dowdell Frank J | -- | -- | |
| Dowdell Frank J | $62,000 | -- | |
| Robert C Ruggerio | -- | -- | |
| Ruggerio Robt C | -- | -- |
Source: Public Records
Mortgage History
We collect this data history from publicly available records. To have your information removed, we recommend requesting removal directly through your county’s website.
| Date | Status | Borrower | Loan Amount |
|---|---|---|---|
| Open | Thompson Bruce W | $94,223 |
Source: Public Records
Tax History
| Year | Tax Paid | Tax Assessment Tax Assessment Total Assessment is a certain percentage of the fair market value that is determined by local assessors to be the total taxable value of land and additions on the property. | Land | Improvement |
|---|---|---|---|---|
| 2025 | $2,734 | $51,800 | $9,660 | $42,140 |
| 2024 | $2,846 | $51,800 | $9,660 | $42,140 |
| 2023 | $2,581 | $39,550 | $8,540 | $31,010 |
| 2022 | $2,555 | $39,550 | $8,540 | $31,010 |
| 2021 | $2,843 | $39,550 | $8,540 | $31,010 |
| 2020 | $2,174 | $29,960 | $6,480 | $23,490 |
| 2019 | $1,970 | $85,600 | $18,500 | $67,100 |
| 2018 | $1,923 | $29,960 | $6,480 | $23,490 |
| 2017 | $1,965 | $26,220 | $5,180 | $21,040 |
| 2016 | $2,226 | $26,220 | $5,180 | $21,040 |
| 2015 | $1,840 | $26,220 | $5,180 | $21,040 |
| 2014 | $1,840 | $26,220 | $5,180 | $21,040 |
Source: Public Records
Map
Nearby Homes
- 670 Walnut Dr
- 29107 Fuller Ave
- 29023 Weber Ave
- 27182 Oriole Ave
- 754 Hemlock Dr
- 26831 Shoreview Ave
- 29234 Grand Blvd
- 420 E 271st St
- 26890 Drakefield Ave
- 610 E 266th St
- 434 E 272nd St
- 26530 Shoreview Ave
- 406 E 274th St
- 746 N Elmwood Ave
- 26361 Elinore Ave
- 29616 Grand Blvd
- 311 E 262nd St
- 355 E 257th St
- 25671 Farringdon Ave
- 325 E 257th St
Your Personal Tour Guide
Ask me questions while you tour the home.