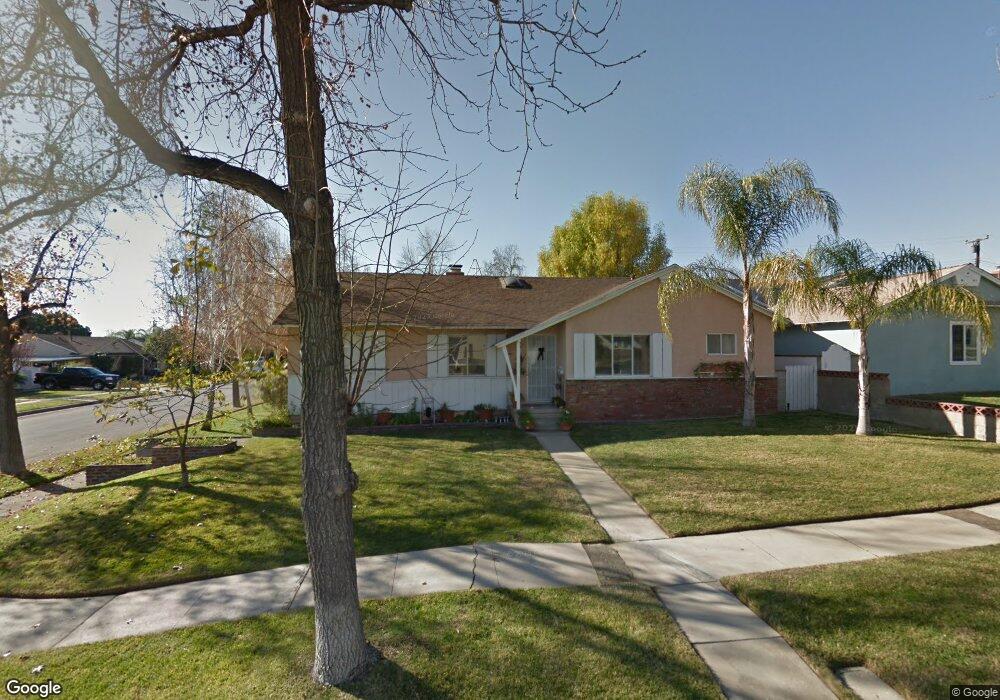
579 Juniper Ave Upland, CA 91786
Estimated Value: $683,000 - $822,000
3
Beds
2
Baths
1,898
Sq Ft
$396/Sq Ft
Est. Value
About This Home
This home is located at 579 Juniper Ave, Upland, CA 91786 and is currently estimated at $751,894, approximately $396 per square foot. 579 Juniper Ave is a home located in San Bernardino County with nearby schools including Baldy View Elementary School, Upland Junior High School, and Upland High School.
Ownership History
Date
Name
Owned For
Owner Type
Purchase Details
Closed on
Jul 2, 2009
Sold by
Manganello Patricia Ann
Bought by
Manganello Patricia Ann and The Patricia Ann Manganello Re
Current Estimated Value
Purchase Details
Closed on
Jun 22, 2001
Sold by
Richardson Jane H
Bought by
Manganello Patricia M
Home Financials for this Owner
Home Financials are based on the most recent Mortgage that was taken out on this home.
Original Mortgage
$125,000
Outstanding Balance
$47,650
Interest Rate
7.15%
Estimated Equity
$704,244
Purchase Details
Closed on
Jul 10, 2000
Sold by
Swiader Benny M
Bought by
Richardson Jane H and The Jane H Richardson Trust
Purchase Details
Closed on
Sep 28, 1994
Sold by
Richardson Jules L
Bought by
Swiader Benny M and Swiader Diane M
Home Financials for this Owner
Home Financials are based on the most recent Mortgage that was taken out on this home.
Original Mortgage
$157,000
Interest Rate
8.86%
Mortgage Type
Seller Take Back
Create a Home Valuation Report for This Property
The Home Valuation Report is an in-depth analysis detailing your home's value as well as a comparison with similar homes in the area
Home Values in the Area
Average Home Value in this Area
Purchase History
| Date | Buyer | Sale Price | Title Company |
|---|---|---|---|
| Manganello Patricia Ann | -- | None Available | |
| Manganello Patricia M | $199,000 | Fidelity National Title | |
| Richardson Jane H | $15,237 | Fidelity National Title Co | |
| Swiader Benny M | $146,000 | Commonwealth Land Title Co |
Source: Public Records
Mortgage History
| Date | Status | Borrower | Loan Amount |
|---|---|---|---|
| Open | Manganello Patricia M | $125,000 | |
| Previous Owner | Swiader Benny M | $157,000 |
Source: Public Records
Tax History
| Year | Tax Paid | Tax Assessment Tax Assessment Total Assessment is a certain percentage of the fair market value that is determined by local assessors to be the total taxable value of land and additions on the property. | Land | Improvement |
|---|---|---|---|---|
| 2025 | $3,286 | $293,986 | $102,894 | $191,092 |
| 2024 | $3,181 | $288,221 | $100,876 | $187,345 |
| 2023 | $3,130 | $282,570 | $98,898 | $183,672 |
| 2022 | $3,061 | $277,030 | $96,959 | $180,071 |
| 2021 | $3,054 | $271,598 | $95,058 | $176,540 |
| 2020 | $2,970 | $268,813 | $94,083 | $174,730 |
| 2019 | $2,959 | $263,542 | $92,238 | $171,304 |
| 2018 | $2,887 | $258,374 | $90,429 | $167,945 |
| 2017 | $2,803 | $253,308 | $88,656 | $164,652 |
| 2016 | $2,610 | $248,342 | $86,918 | $161,424 |
| 2015 | $2,549 | $244,611 | $85,612 | $158,999 |
| 2014 | $2,482 | $239,819 | $83,935 | $155,884 |
Source: Public Records
Map
Nearby Homes
- 595 Juniper Ave
- 633 Maple Way
- 0 Bay St Unit AR25093919
- 846 Amber Ct
- 856 Altura Way
- 762 N Vallejo Way
- 617 N Ukiah Way
- 435 W 9th St Unit B3
- 1019 W Pine St
- 1089 W Pine St Unit E
- 1223 Lenwood Square
- 910 N Redding Way Unit I
- 910 N Redding Way Unit F
- 855 N Palm Ave
- 636 N Palm Ave
- 1496 Corte Hacienda Unit 1
- 134 Coral Way
- 126 Irving Way
- 306 S Vallejo Way
- 428 W 8th St
Your Personal Tour Guide
Ask me questions while you tour the home.