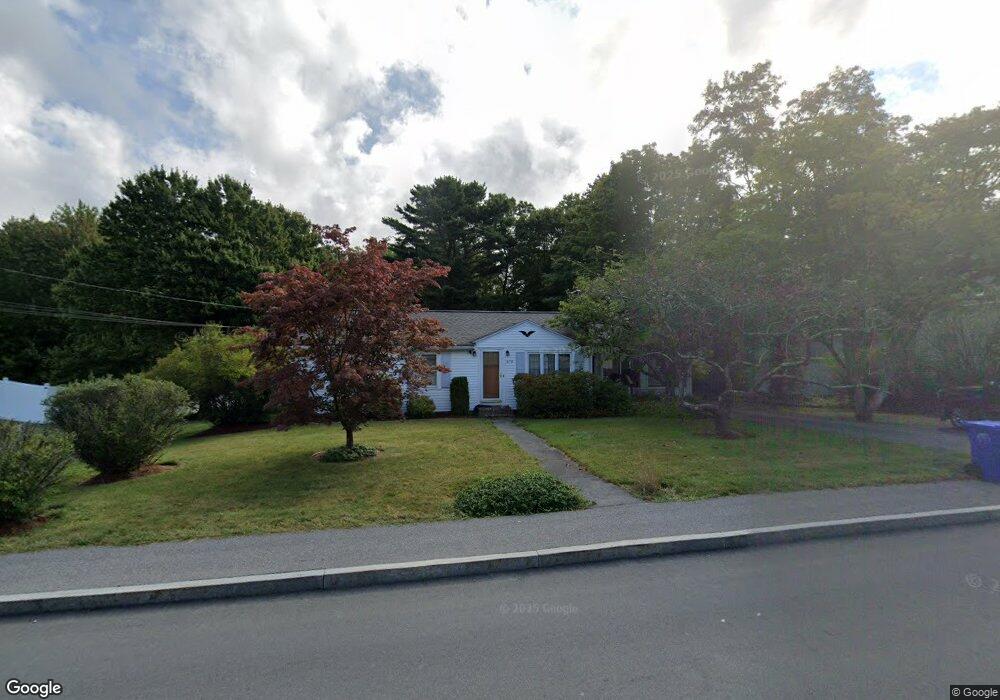
579 Liberty St Rockland, MA 02370
Estimated Value: $446,000 - $544,765
--
Bed
1
Bath
1,236
Sq Ft
$410/Sq Ft
Est. Value
About This Home
This home is located at 579 Liberty St, Rockland, MA 02370 and is currently estimated at $506,691, approximately $409 per square foot. 579 Liberty St is a home located in Plymouth County with nearby schools including Rockland Senior High School, Calvary Chapel Academy, and St Bridget School.
Ownership History
Date
Name
Owned For
Owner Type
Purchase Details
Closed on
Mar 6, 2013
Sold by
Crossman Michael and Crossman Jean
Bought by
Crossman Daniel
Current Estimated Value
Home Financials for this Owner
Home Financials are based on the most recent Mortgage that was taken out on this home.
Original Mortgage
$192,000
Outstanding Balance
$134,935
Interest Rate
3.45%
Mortgage Type
New Conventional
Estimated Equity
$371,756
Create a Home Valuation Report for This Property
The Home Valuation Report is an in-depth analysis detailing your home's value as well as a comparison with similar homes in the area
Home Values in the Area
Average Home Value in this Area
Purchase History
| Date | Buyer | Sale Price | Title Company |
|---|---|---|---|
| Crossman Daniel | $240,000 | -- | |
| Crossman Daniel | $240,000 | -- |
Source: Public Records
Mortgage History
| Date | Status | Borrower | Loan Amount |
|---|---|---|---|
| Open | Crossman Daniel | $192,000 | |
| Closed | Crossman Daniel | $192,000 |
Source: Public Records
Tax History Compared to Growth
Tax History
| Year | Tax Paid | Tax Assessment Tax Assessment Total Assessment is a certain percentage of the fair market value that is determined by local assessors to be the total taxable value of land and additions on the property. | Land | Improvement |
|---|---|---|---|---|
| 2025 | $6,717 | $491,400 | $247,300 | $244,100 |
| 2024 | $6,521 | $463,800 | $233,300 | $230,500 |
| 2023 | $6,688 | $439,400 | $224,800 | $214,600 |
| 2022 | $6,338 | $378,400 | $195,500 | $182,900 |
| 2021 | $7,221 | $340,200 | $177,700 | $162,500 |
| 2020 | $5,668 | $323,900 | $169,200 | $154,700 |
| 2019 | $5,570 | $310,800 | $161,200 | $149,600 |
| 2018 | $5,242 | $287,700 | $164,600 | $123,100 |
| 2017 | $5,112 | $276,600 | $164,600 | $112,000 |
| 2016 | $4,946 | $267,500 | $158,300 | $109,200 |
| 2015 | $4,704 | $247,200 | $148,000 | $99,200 |
| 2014 | $4,447 | $242,500 | $145,200 | $97,300 |
Source: Public Records
Map
Nearby Homes
- 507 Liberty St
- 83 Summit St
- 14 Dyer St Unit 14
- 13 Dyer St Unit 13
- 12 Dyer St Unit 12
- 354 Webster St
- 63 Webster St
- 737-739 Union St
- 436 E Water St
- 45-47 Park St
- 775 Union St
- 206-208 Hinghm St
- 35-37 Salem St
- 100 North Ave
- 10 Horn Beam St Unit 299
- 9 Juniper Cir
- 5 Juniper Cir
- 18 Midfield Dr
- 1 Canterbury Ln
- 86 Leisurewoods Dr Unit 279