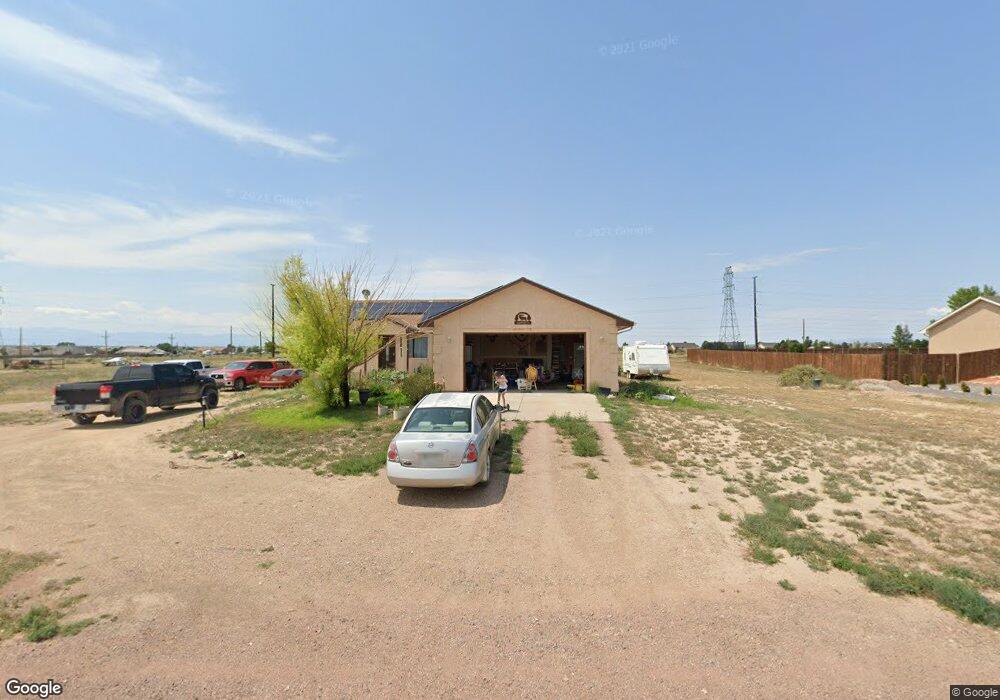
579 N Canvas Dr Unit 33 Pueblo, CO 81007
Estimated Value: $381,000 - $397,542
3
Beds
3
Baths
1,378
Sq Ft
$284/Sq Ft
Est. Value
About This Home
This home is located at 579 N Canvas Dr Unit 33, Pueblo, CO 81007 and is currently estimated at $391,136, approximately $283 per square foot. 579 N Canvas Dr Unit 33 is a home located in Pueblo County with nearby schools including Prairie Winds Elementary School, Liberty Point International School, and Pueblo West High School.
Ownership History
Date
Name
Owned For
Owner Type
Purchase Details
Closed on
Sep 28, 2007
Sold by
Lujan Dennis J
Bought by
Kenney Noah
Current Estimated Value
Home Financials for this Owner
Home Financials are based on the most recent Mortgage that was taken out on this home.
Original Mortgage
$157,000
Outstanding Balance
$100,311
Interest Rate
6.66%
Mortgage Type
Purchase Money Mortgage
Estimated Equity
$290,825
Purchase Details
Closed on
Jan 18, 2007
Sold by
Schilling Thomas R
Bought by
Lujan Dennis J
Purchase Details
Closed on
Aug 5, 2005
Sold by
Haney Branson A
Bought by
Schilling Thomas R
Home Financials for this Owner
Home Financials are based on the most recent Mortgage that was taken out on this home.
Original Mortgage
$17,635
Interest Rate
5.55%
Mortgage Type
Purchase Money Mortgage
Create a Home Valuation Report for This Property
The Home Valuation Report is an in-depth analysis detailing your home's value as well as a comparison with similar homes in the area
Home Values in the Area
Average Home Value in this Area
Purchase History
| Date | Buyer | Sale Price | Title Company |
|---|---|---|---|
| Kenney Noah | $157,000 | Landamerica | |
| Lujan Dennis J | $18,000 | Landamerica | |
| Schilling Thomas R | $17,000 | Stewart Title Of Pueblo |
Source: Public Records
Mortgage History
| Date | Status | Borrower | Loan Amount |
|---|---|---|---|
| Open | Kenney Noah | $157,000 | |
| Previous Owner | Schilling Thomas R | $17,635 |
Source: Public Records
Tax History Compared to Growth
Tax History
| Year | Tax Paid | Tax Assessment Tax Assessment Total Assessment is a certain percentage of the fair market value that is determined by local assessors to be the total taxable value of land and additions on the property. | Land | Improvement |
|---|---|---|---|---|
| 2024 | $2,126 | $21,180 | -- | -- |
| 2023 | $2,150 | $24,860 | $3,580 | $21,280 |
| 2022 | $1,882 | $18,760 | $2,330 | $16,430 |
| 2021 | $1,931 | $19,310 | $2,400 | $16,910 |
| 2020 | $1,595 | $19,310 | $2,400 | $16,910 |
| 2019 | $1,591 | $15,915 | $965 | $14,950 |
| 2018 | $1,396 | $13,967 | $540 | $13,427 |
| 2017 | $1,398 | $13,967 | $540 | $13,427 |
| 2016 | $1,313 | $13,140 | $637 | $12,503 |
| 2015 | $1,302 | $13,140 | $637 | $12,503 |
| 2014 | $1,201 | $12,109 | $756 | $11,353 |
Source: Public Records
Map
Nearby Homes
- 574 N Canvas Dr
- 562 N Mancos Dr
- 546 N Mancos Dr
- 522 N Mancos Dr
- 1186 E Desert Cove Dr
- 977 E Sumac Dr
- 1174 E Escondido Dr
- 766 N Iliff Dr
- 633 N Iliff Dr
- 902 E Platteville Blvd
- 869 E Platteville Blvd
- 559 N Iliff Dr
- 1309 E Jaroso Dr
- 688 Maplelawn Dr
- 866 E Snyder Dr
- 923 E Platteville Blvd
- 571 Campbell Dr
- 577 & 571 N Boyero Ave
- 535 N Boyero Ave
- 729 Mapleleaf Dr
- 579 N Canvas Dr
- 583 N Canvas Dr Unit 34
- 583 N Canvas Dr
- 584 N Canvas Dr
- 584 N Canvas Dr Unit 15
- 587 N Canvas Dr
- 563 N Canvas Dr
- 566 N Canvas Dr
- 566 N Canvas Dr Unit 13
- 590 N Canvas Dr
- 595 N Canvas Dr
- 601 N Verbena Dr Unit 2
- 1101 E Escondido Dr Unit 12
- 1101 E Escondido Dr
- 607 N Canvas Dr
- 1495 N Llama Dr
- 1495 N Llama Dr
- 1495 N Llama Dr
- 1495 N Llama Dr
- 1495 N Llama Dr