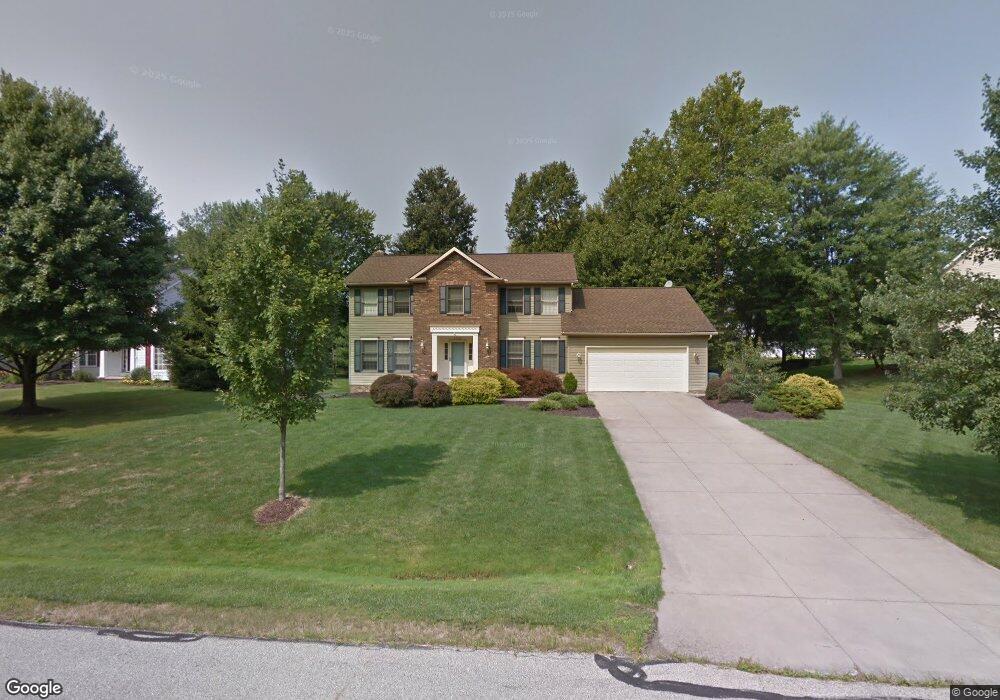
5790 Nicholson Dr Hudson, OH 44236
Estimated Value: $499,961 - $541,000
4
Beds
3
Baths
2,534
Sq Ft
$205/Sq Ft
Est. Value
About This Home
This home is located at 5790 Nicholson Dr, Hudson, OH 44236 and is currently estimated at $518,240, approximately $204 per square foot. 5790 Nicholson Dr is a home located in Summit County with nearby schools including Ellsworth Hill Elementary School, East Woods Intermediate School, and Hudson Middle School.
Ownership History
Date
Name
Owned For
Owner Type
Purchase Details
Closed on
Jan 29, 1999
Sold by
Zimmerman Roy and Zimmerman Karen L
Bought by
Benchek James P and Benchek Cynthia A
Current Estimated Value
Home Financials for this Owner
Home Financials are based on the most recent Mortgage that was taken out on this home.
Original Mortgage
$120,000
Interest Rate
6.75%
Purchase Details
Closed on
Sep 21, 1995
Sold by
Tschantz Curtiss G
Bought by
Zimmerman Roy and Zimmerman Karen L
Home Financials for this Owner
Home Financials are based on the most recent Mortgage that was taken out on this home.
Original Mortgage
$175,875
Interest Rate
7.78%
Mortgage Type
New Conventional
Create a Home Valuation Report for This Property
The Home Valuation Report is an in-depth analysis detailing your home's value as well as a comparison with similar homes in the area
Home Values in the Area
Average Home Value in this Area
Purchase History
| Date | Buyer | Sale Price | Title Company |
|---|---|---|---|
| Benchek James P | $219,000 | Midland Commerce Group | |
| Zimmerman Roy | $234,500 | -- |
Source: Public Records
Mortgage History
| Date | Status | Borrower | Loan Amount |
|---|---|---|---|
| Closed | Benchek James P | $120,000 | |
| Previous Owner | Zimmerman Roy | $175,875 |
Source: Public Records
Tax History
| Year | Tax Paid | Tax Assessment Tax Assessment Total Assessment is a certain percentage of the fair market value that is determined by local assessors to be the total taxable value of land and additions on the property. | Land | Improvement |
|---|---|---|---|---|
| 2025 | $7,139 | $139,969 | $32,375 | $107,594 |
| 2024 | $7,139 | $139,969 | $32,375 | $107,594 |
| 2023 | $7,139 | $139,969 | $32,375 | $107,594 |
| 2022 | $6,512 | $113,887 | $26,320 | $87,567 |
| 2021 | $6,523 | $113,887 | $26,320 | $87,567 |
| 2020 | $6,408 | $113,890 | $26,320 | $87,570 |
| 2019 | $6,962 | $114,670 | $26,320 | $88,350 |
| 2018 | $6,937 | $114,670 | $26,320 | $88,350 |
| 2017 | $6,141 | $114,670 | $26,320 | $88,350 |
| 2016 | $6,185 | $98,550 | $26,320 | $72,230 |
| 2015 | $6,141 | $98,550 | $26,320 | $72,230 |
| 2014 | $6,158 | $98,550 | $26,320 | $72,230 |
| 2013 | $5,509 | $85,970 | $26,320 | $59,650 |
Source: Public Records
Map
Nearby Homes
- 6101 Independence Dr
- 734 Barlow Rd
- 5406 Towbridge Dr
- 8 Hudson Common Dr Unit 8
- 381 Boston Mills Rd
- 34 Chadbourne Dr
- 5974 Anna Lee Dr
- 503 Cutler Ln
- 5469 Sullivan Rd
- 61 Lake Forest Dr
- 171 Ravenna St
- 100 Blackberry Dr
- 6562 Regal Woods Dr
- 42 Fox Trace Ln
- 0 Olde Eight Rd Unit 5156367
- 24 Morning Song Ln
- 213 E Streetsboro St
- 1620 Sapphire Dr
- 77 Parmelee Dr
- 5123 Sodalite Dr
- 5780 Nicholson Dr
- 5808 Nicholson Dr
- 5829 Alisa Ct
- 5819 Alisa Ct
- 5770 Nicholson Dr
- 5791 Nicholson Dr
- 5839 Alisa Ct
- 5801 Nicholson Dr
- 5781 Nicholson Dr
- 5809 Alisa Ct
- 5811 Nicholson Dr
- 5760 Nicholson Dr
- 5771 Nicholson Dr
- 105 Nicholson Dr
- 49 Nicholson Dr
- 6 Nicholson Dr
- 64 Nicholson Dr
- 90 Nicholson Dr
- 92 Nicholson Dr
- 91 Nicholson Dr
Your Personal Tour Guide
Ask me questions while you tour the home.