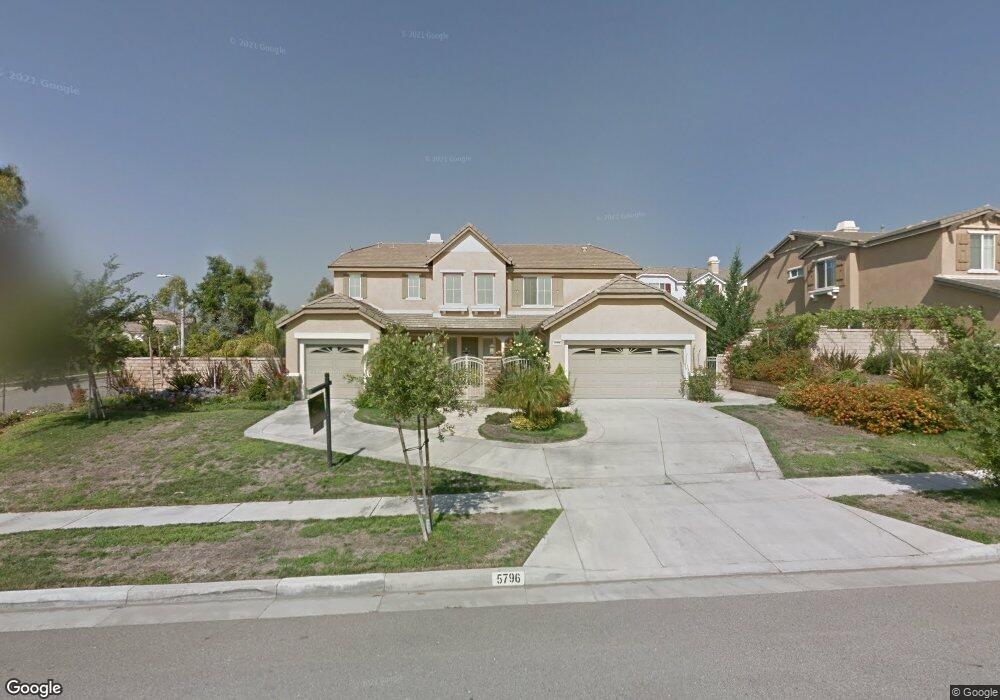
5796 Santa Ynez Place Rancho Cucamonga, CA 91739
Etiwanda NeighborhoodEstimated Value: $1,187,945 - $1,350,000
5
Beds
4
Baths
3,369
Sq Ft
$377/Sq Ft
Est. Value
About This Home
This home is located at 5796 Santa Ynez Place, Rancho Cucamonga, CA 91739 and is currently estimated at $1,268,736, approximately $376 per square foot. 5796 Santa Ynez Place is a home located in San Bernardino County with nearby schools including Etiwanda Colony Elementary, Summit Intermediate, and Etiwanda High.
Ownership History
Date
Name
Owned For
Owner Type
Purchase Details
Closed on
Aug 16, 2011
Sold by
Aurora Loan Services Llc
Bought by
Daily Fred and Daily Marites M
Current Estimated Value
Home Financials for this Owner
Home Financials are based on the most recent Mortgage that was taken out on this home.
Original Mortgage
$360,000
Outstanding Balance
$248,211
Interest Rate
4.48%
Mortgage Type
New Conventional
Estimated Equity
$1,020,525
Purchase Details
Closed on
May 31, 2011
Sold by
Fetalino Deogracias B A
Bought by
Aurora Loan Services Llc
Purchase Details
Closed on
Sep 22, 2005
Sold by
Pulte Home Corp
Bought by
Fetalino Deogracias B A and Fetalino F
Home Financials for this Owner
Home Financials are based on the most recent Mortgage that was taken out on this home.
Original Mortgage
$631,250
Interest Rate
1%
Mortgage Type
Fannie Mae Freddie Mac
Create a Home Valuation Report for This Property
The Home Valuation Report is an in-depth analysis detailing your home's value as well as a comparison with similar homes in the area
Home Values in the Area
Average Home Value in this Area
Purchase History
| Date | Buyer | Sale Price | Title Company |
|---|---|---|---|
| Daily Fred | $460,000 | Lps Default Title & Closing | |
| Aurora Loan Services Llc | $476,000 | Accommodation | |
| Fetalino Deogracias B A | $789,500 | Chicago Title Company |
Source: Public Records
Mortgage History
| Date | Status | Borrower | Loan Amount |
|---|---|---|---|
| Open | Daily Fred | $360,000 | |
| Previous Owner | Fetalino Deogracias B A | $631,250 |
Source: Public Records
Tax History Compared to Growth
Tax History
| Year | Tax Paid | Tax Assessment Tax Assessment Total Assessment is a certain percentage of the fair market value that is determined by local assessors to be the total taxable value of land and additions on the property. | Land | Improvement |
|---|---|---|---|---|
| 2025 | $9,732 | $577,786 | $100,486 | $477,300 |
| 2024 | $9,732 | $566,457 | $98,516 | $467,941 |
| 2023 | $9,583 | $555,350 | $96,584 | $458,766 |
| 2022 | $9,514 | $544,461 | $94,690 | $449,771 |
| 2021 | $9,382 | $533,785 | $92,833 | $440,952 |
| 2020 | $9,246 | $528,312 | $91,881 | $436,431 |
| 2019 | $9,002 | $517,953 | $90,079 | $427,874 |
| 2018 | $9,091 | $507,797 | $88,313 | $419,484 |
| 2017 | $8,788 | $497,840 | $86,581 | $411,259 |
| 2016 | $8,560 | $488,078 | $84,883 | $403,195 |
| 2015 | $8,454 | $480,747 | $83,608 | $397,139 |
| 2014 | $8,290 | $471,330 | $81,970 | $389,360 |
Source: Public Records
Map
Nearby Homes
- 13861 Laurel Tree Dr
- 12859 Dove Wood Dr
- 0 Wardman Bullock Rd
- 14058 Pearson Ct
- 5672 San Marino Way
- 14113 Los Robles Ct
- 14201 Ross Ct
- 14138 Crescenta Way
- 13982 Claremont Ln
- 6136 Walnut Grove Ct
- 6072 Blossom Place
- 14048 Annandale Ln
- 14080 Crestline Place
- 14552 Boots Ln
- 5655 Lone Pine Dr
- 5498 Withers Ave
- 13812 Breeders Cup Dr
- 13428 Silver Sky Rd
- 5156 Branding Iron Place
- 14181 Vai Brothers Dr
- 5776 Santa Ynez Place
- 5791 Santa fe Ct
- 5781 Santa fe Ct
- 5797 Santa Ynez Place
- 5777 Santa Ynez Place
- 13909 Dove Wood Dr
- 5766 Santa Ynez Place
- 5807 Santa Ynez Place
- 5771 Santa fe Ct
- 13899 Dove Wood Dr
- 5767 Santa Ynez Place
- 5827 Santa Ynez Place
- 12889 Dove Wood Dr
- 5790 Santa fe Ct
- 5746 Santa Ynez Place
- 5782 Green Pine Ct
- 5802 Green Pine Ct
- 13901 Laurel Tree Dr
- 5780 Santa fe Ct
- 5837 Santa Ynez Place