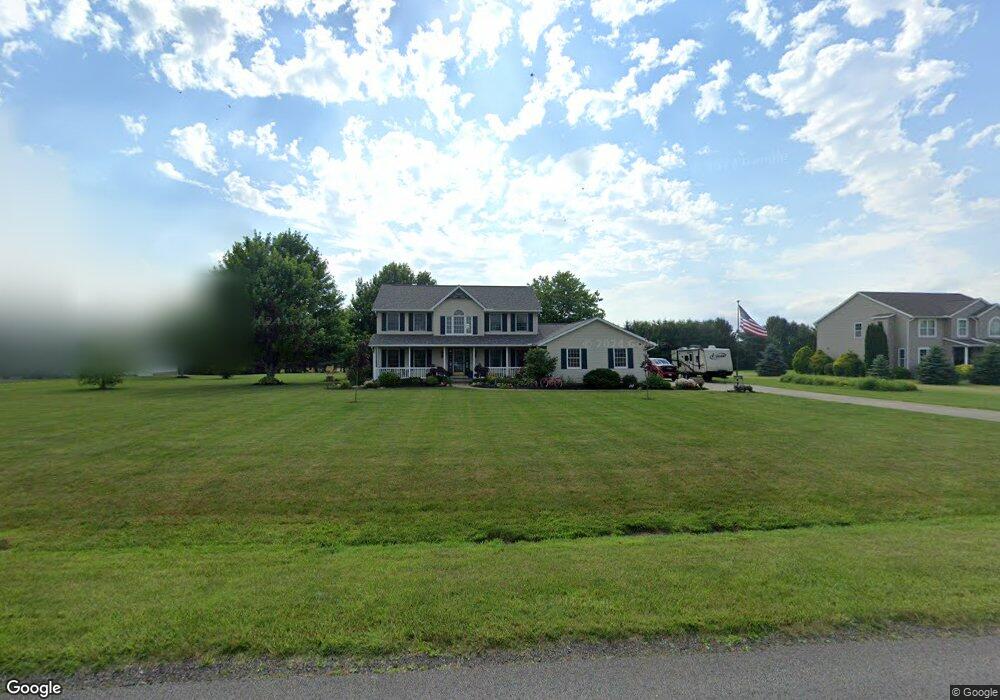
5799 Stonesthrow Dr Wooster, OH 44691
Estimated Value: $411,457 - $524,000
3
Beds
3
Baths
2,114
Sq Ft
$220/Sq Ft
Est. Value
About This Home
This home is located at 5799 Stonesthrow Dr, Wooster, OH 44691 and is currently estimated at $465,614, approximately $220 per square foot. 5799 Stonesthrow Dr is a home located in Wayne County with nearby schools including Kean Elementary School, Parkview Elementary School, and Edgewood Middle School.
Ownership History
Date
Name
Owned For
Owner Type
Purchase Details
Closed on
Aug 10, 2016
Sold by
Chapin Barbara A
Bought by
Buckner David B and Buckner Joyce
Current Estimated Value
Home Financials for this Owner
Home Financials are based on the most recent Mortgage that was taken out on this home.
Original Mortgage
$225,000
Outstanding Balance
$179,524
Interest Rate
3.48%
Mortgage Type
New Conventional
Estimated Equity
$286,090
Purchase Details
Closed on
Apr 25, 2016
Sold by
Chapin Richard H
Bought by
Barbara A Chapin
Purchase Details
Closed on
Sep 29, 2003
Sold by
Deal Land Co Llc
Bought by
Chapin Richard H and Chapin Barbara A
Home Financials for this Owner
Home Financials are based on the most recent Mortgage that was taken out on this home.
Original Mortgage
$203,000
Interest Rate
6.4%
Mortgage Type
Construction
Create a Home Valuation Report for This Property
The Home Valuation Report is an in-depth analysis detailing your home's value as well as a comparison with similar homes in the area
Home Values in the Area
Average Home Value in this Area
Purchase History
| Date | Buyer | Sale Price | Title Company |
|---|---|---|---|
| Buckner David B | $250,000 | Service First Title Agency | |
| Barbara A Chapin | -- | -- | |
| Chapin Richard H | $34,500 | Midland Title Security Inc |
Source: Public Records
Mortgage History
| Date | Status | Borrower | Loan Amount |
|---|---|---|---|
| Open | Buckner David B | $225,000 | |
| Previous Owner | Chapin Richard H | $203,000 |
Source: Public Records
Tax History
| Year | Tax Paid | Tax Assessment Tax Assessment Total Assessment is a certain percentage of the fair market value that is determined by local assessors to be the total taxable value of land and additions on the property. | Land | Improvement |
|---|---|---|---|---|
| 2024 | $4,897 | $113,140 | $23,890 | $89,250 |
| 2023 | $4,916 | $113,140 | $23,890 | $89,250 |
| 2022 | $4,321 | $79,680 | $16,830 | $62,850 |
| 2021 | $4,453 | $79,680 | $16,830 | $62,850 |
| 2020 | $4,231 | $79,680 | $16,830 | $62,850 |
| 2019 | $4,423 | $79,550 | $13,840 | $65,710 |
| 2018 | $4,435 | $79,550 | $13,840 | $65,710 |
| 2017 | $4,460 | $79,550 | $13,840 | $65,710 |
| 2016 | $4,590 | $76,490 | $13,310 | $63,180 |
| 2015 | $4,510 | $76,490 | $13,310 | $63,180 |
| 2014 | $4,424 | $76,490 | $13,310 | $63,180 |
| 2013 | $4,330 | $73,890 | $11,200 | $62,690 |
Source: Public Records
Map
Nearby Homes
- 4975 Clearcreek Valley Rd
- 4710 Braxton Ln
- 4624 Deer Creek Dr
- 4553 Deer Creek Dr
- 4366 Wood Lake Trail
- 4391 Hunters Chase Ln
- 4185 Mechanicsburg Rd
- 4327 Hunters Chase Ln
- 1446 Nupp Dr
- 5852 Cleveland Rd Unit 59
- 1430 Ashton Way
- 1120 Kadas Ln
- 1106 Kadas Ln
- 1024 Kadas Ln
- 4351 Wilson Rd
- 1087 Jesse Owens Dr
- 3459 Burbank Rd
- 2291 Armstrong Rd
- 4156 Fieldridge Ct
- 2009 Myrta Dr
- 0 Stonesthrow Dr Unit 75807
- 0 Stonesthrow Dr Unit 75804
- 0 Stonesthrow Dr Unit 212776
- 0 Stonesthrow Dr Unit 35
- 5759 Stonesthrow Dr
- 5839 Stonesthrow Dr
- 5780 Stonesthrow Dr
- 5879 Stonesthrow Dr
- 5715 Stonesthrow Dr
- 5738 Stonesthrow Dr
- 5880 Stonesthrow Dr
- 5913 Stonesthrow Dr
- 5678 Stonesthrow Dr
- 5675 Stonesthrow Dr
- 5959 Stonesthrow Dr
- 5635 Stonesthrow Dr
- 1320 W Hutton Rd
- 1030 W Hutton Rd
- 1094 W Hutton Rd
- 5600 Stonesthrow Dr
Your Personal Tour Guide
Ask me questions while you tour the home.