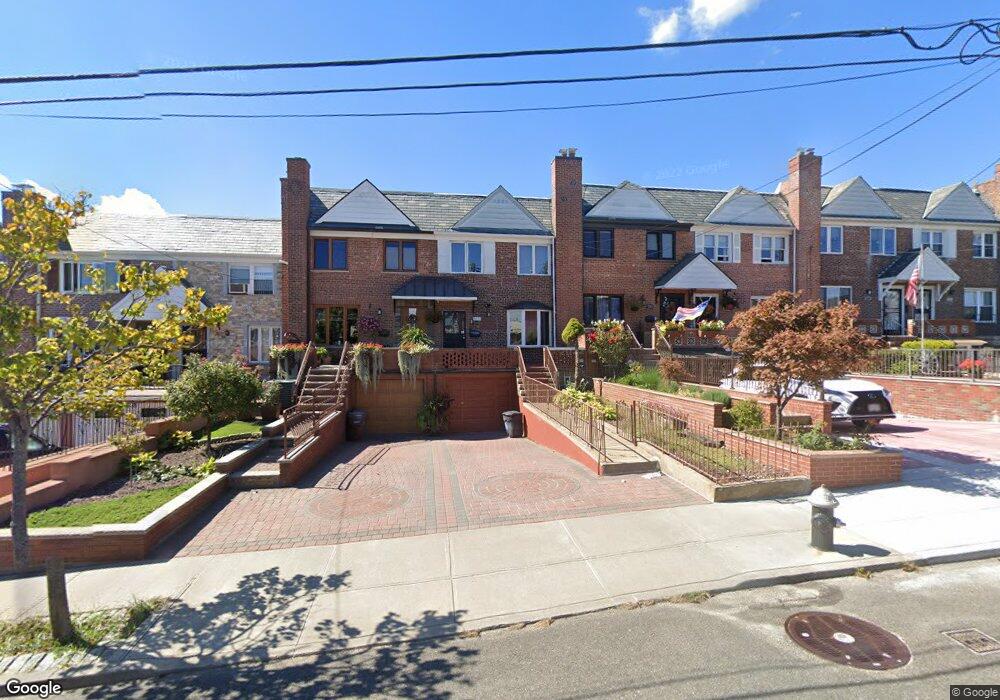
58-14 79th St Flushing, NY 11379
Maspeth NeighborhoodEstimated Value: $849,000 - $940,000
3
Beds
2
Baths
1,600
Sq Ft
$563/Sq Ft
Est. Value
About This Home
This home is located at 58-14 79th St, Flushing, NY 11379 and is currently estimated at $900,650, approximately $562 per square foot. 58-14 79th St is a home located in Queens County with nearby schools including Ps 58 School Of Heroes, IS 73 - The Frank Sansivieri School, and Newtown High School.
Ownership History
Date
Name
Owned For
Owner Type
Purchase Details
Closed on
Sep 9, 2021
Sold by
Santos Adriana C and Santos Enrique
Bought by
Jiang Shuiyu and Lin Chuanqin
Current Estimated Value
Home Financials for this Owner
Home Financials are based on the most recent Mortgage that was taken out on this home.
Original Mortgage
$390,000
Outstanding Balance
$354,871
Interest Rate
2.8%
Mortgage Type
Purchase Money Mortgage
Estimated Equity
$545,779
Create a Home Valuation Report for This Property
The Home Valuation Report is an in-depth analysis detailing your home's value as well as a comparison with similar homes in the area
Home Values in the Area
Average Home Value in this Area
Purchase History
| Date | Buyer | Sale Price | Title Company |
|---|---|---|---|
| Jiang Shuiyu | $860,000 | -- |
Source: Public Records
Mortgage History
| Date | Status | Borrower | Loan Amount |
|---|---|---|---|
| Open | Jiang Shuiyu | $390,000 |
Source: Public Records
Tax History Compared to Growth
Tax History
| Year | Tax Paid | Tax Assessment Tax Assessment Total Assessment is a certain percentage of the fair market value that is determined by local assessors to be the total taxable value of land and additions on the property. | Land | Improvement |
|---|---|---|---|---|
| 2025 | $7,340 | $37,656 | $11,279 | $26,377 |
| 2024 | $7,340 | $36,547 | $11,091 | $25,456 |
| 2023 | $6,994 | $34,824 | $11,154 | $23,670 |
| 2022 | $6,609 | $47,820 | $15,240 | $32,580 |
| 2021 | $6,309 | $46,500 | $15,240 | $31,260 |
| 2020 | $5,259 | $46,560 | $15,240 | $31,320 |
| 2019 | $6,078 | $44,400 | $15,240 | $29,160 |
| 2018 | $5,618 | $29,020 | $10,575 | $18,445 |
| 2017 | $5,324 | $27,588 | $10,490 | $17,098 |
| 2016 | $4,919 | $27,588 | $10,490 | $17,098 |
| 2015 | $2,919 | $26,150 | $13,531 | $12,619 |
| 2014 | $2,919 | $25,380 | $14,229 | $11,151 |
Source: Public Records
Map
Nearby Homes
- 5853 79th St
- 58-39 77th Place
- 60-10 79th St
- 76-22 57th Rd
- 60-35 77th St
- 61-16 81st St
- 7521 Caldwell Ave
- 61-33 78th St
- 58-25 83rd St
- 6134 80th St
- 8230 58th Ave
- 61-41 77th Place
- 5810 83rd Place
- 8318 58th Ave
- 5736 75th St
- 5745 74th St Unit 106
- 5745 74th St Unit 306
- 8223 Caldwell Ave
- 61-75 79th St
- 60-40 75th St