58 American Walk Peachtree City, GA 30269
Estimated Value: $406,346 - $475,000
--
Bed
1
Bath
1,812
Sq Ft
$242/Sq Ft
Est. Value
About This Home
This home is located at 58 American Walk, Peachtree City, GA 30269 and is currently estimated at $439,337, approximately $242 per square foot. 58 American Walk is a home located in Fayette County with nearby schools including Peachtree City Elementary School, Booth Middle School, and McIntosh High School.
Ownership History
Date
Name
Owned For
Owner Type
Purchase Details
Closed on
Dec 23, 2019
Sold by
Massmann Antoinette A
Bought by
58 American Walk Llc
Current Estimated Value
Purchase Details
Closed on
Feb 15, 2013
Sold by
Rodgers Erica Massman
Bought by
Massman Antonette A
Purchase Details
Closed on
Feb 10, 2009
Sold by
Mortensen Beth
Bought by
Pendergrass Erica A
Home Financials for this Owner
Home Financials are based on the most recent Mortgage that was taken out on this home.
Original Mortgage
$191,340
Interest Rate
5.08%
Mortgage Type
FHA
Purchase Details
Closed on
Jul 29, 2004
Sold by
John Wieland Homes & Neighborhoo
Bought by
Mortensen Beth
Home Financials for this Owner
Home Financials are based on the most recent Mortgage that was taken out on this home.
Original Mortgage
$159,042
Interest Rate
5.96%
Mortgage Type
New Conventional
Create a Home Valuation Report for This Property
The Home Valuation Report is an in-depth analysis detailing your home's value as well as a comparison with similar homes in the area
Home Values in the Area
Average Home Value in this Area
Purchase History
| Date | Buyer | Sale Price | Title Company |
|---|---|---|---|
| 58 American Walk Llc | -- | -- | |
| Massman Antonette A | $287,000 | -- | |
| Pendergrass Erica A | $195,000 | -- | |
| Mortensen Beth | $212,100 | -- |
Source: Public Records
Mortgage History
| Date | Status | Borrower | Loan Amount |
|---|---|---|---|
| Previous Owner | Pendergrass Erica A | $191,340 | |
| Previous Owner | Mortensen Beth | $159,042 |
Source: Public Records
Tax History Compared to Growth
Tax History
| Year | Tax Paid | Tax Assessment Tax Assessment Total Assessment is a certain percentage of the fair market value that is determined by local assessors to be the total taxable value of land and additions on the property. | Land | Improvement |
|---|---|---|---|---|
| 2024 | $4,152 | $140,488 | $26,400 | $114,088 |
| 2023 | $4,092 | $134,880 | $26,400 | $108,480 |
| 2022 | $3,917 | $129,320 | $26,400 | $102,920 |
| 2021 | $3,521 | $114,600 | $20,000 | $94,600 |
| 2020 | $3,218 | $103,640 | $15,200 | $88,440 |
| 2019 | $3,360 | $107,160 | $15,200 | $91,960 |
| 2018 | $3,195 | $100,280 | $15,200 | $85,080 |
| 2017 | $3,068 | $95,640 | $15,200 | $80,440 |
| 2016 | $3,283 | $98,600 | $15,200 | $83,400 |
| 2015 | $2,857 | $84,400 | $15,200 | $69,200 |
| 2014 | $2,735 | $79,400 | $15,200 | $64,200 |
| 2013 | -- | $77,920 | $0 | $0 |
Source: Public Records
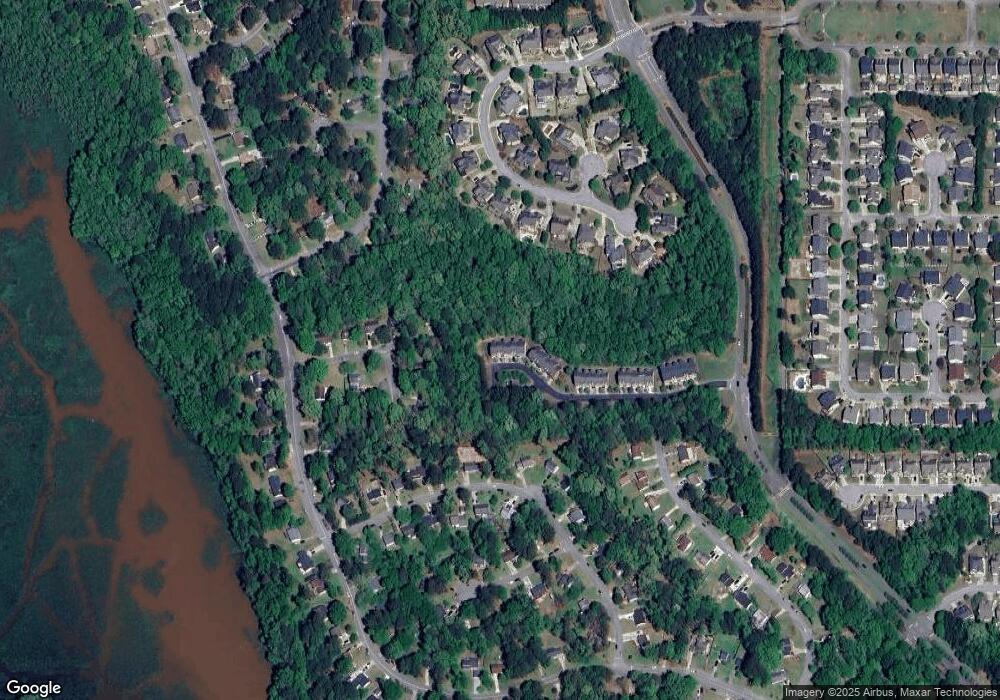
Map
Nearby Homes
- 100 Kings Ridge Dr
- 64 Star Spangled Ln
- 171 Wynnmeade Pkwy
- 169 Wynnmeade Pkwy
- 138 Wynnmeade Pkwy
- 719 Gittings Ave
- 22 Star Spangled Ln
- 405 Abbey Rd
- 844 Richmond Cir Unit 7
- 826 Richmond Cir
- 147 Westberry St
- 101 Eadestowne Way
- 105 Bandon Way
- 102 Bandon Way
- 103 Bandon Way
- 111 S Fairfield Dr
- 107 S Fairfield Dr
- 0 Highway 54 Unit 7182931
- 0 Highway 54 Unit 10139299
- 0 Highway 54 Unit 10135435
- 54 American Walk Unit 23
- 52 American Walk
- 50 American Walk Unit 21
- 50 American Walk Unit 50
- 48 American Walk
- 48 American Walk Unit 48
- 46 American Walk
- 44 American Walk
- 42 American Walk
- 40 American Walk
- 101 Meadow Ct
- 109 Meadow Rd
- 38 American Walk Unit 15
- 38 American Walk
- 103 Meadow Ct
- 36 American Walk
- 34 American Walk
- 120 Kings Ridge Dr
- 32 American Walk Unit 12
- 107 Meadow Rd Unit 5