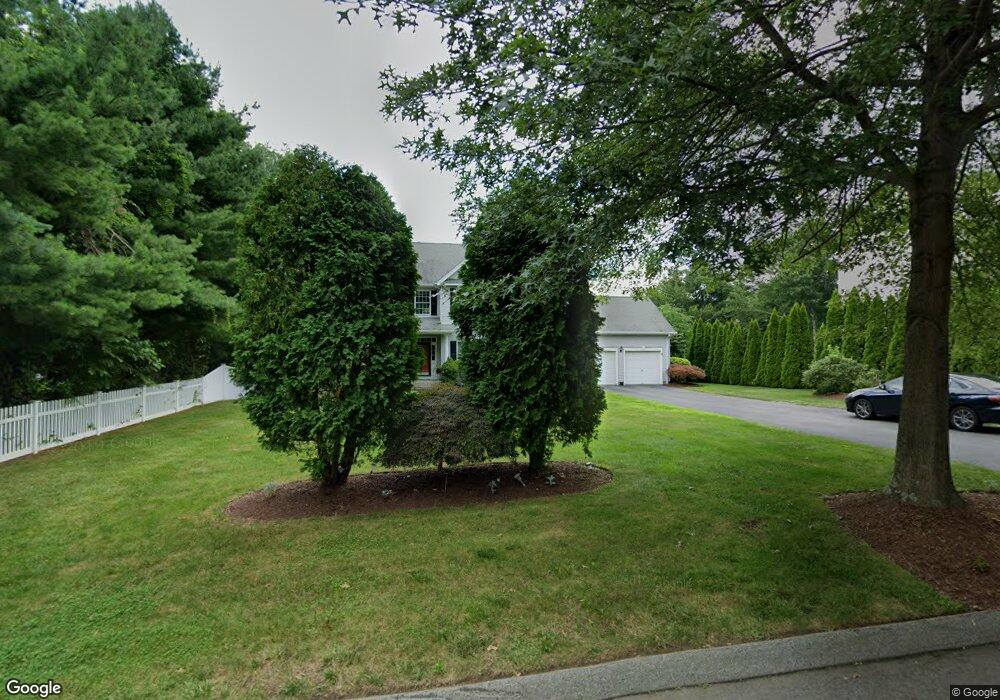
58 Augusta Dr Milford, CT 06461
Parkway/Wheelers Farm Road NeighborhoodEstimated Value: $859,000 - $1,064,000
4
Beds
2
Baths
3,136
Sq Ft
$299/Sq Ft
Est. Value
About This Home
This home is located at 58 Augusta Dr, Milford, CT 06461 and is currently estimated at $937,126, approximately $298 per square foot. 58 Augusta Dr is a home located in New Haven County with nearby schools including Orange Avenue School, Harborside Middle School, and Jonathan Law High School.
Ownership History
Date
Name
Owned For
Owner Type
Purchase Details
Closed on
Jan 18, 2017
Sold by
David Nigel M
Bought by
Udoyen Ubong J
Current Estimated Value
Home Financials for this Owner
Home Financials are based on the most recent Mortgage that was taken out on this home.
Original Mortgage
$479,750
Outstanding Balance
$395,470
Interest Rate
4.13%
Mortgage Type
Unknown
Estimated Equity
$541,656
Purchase Details
Closed on
Oct 4, 2012
Sold by
Pallman David C
Bought by
David Nigel M
Home Financials for this Owner
Home Financials are based on the most recent Mortgage that was taken out on this home.
Original Mortgage
$309,000
Interest Rate
3.66%
Mortgage Type
New Conventional
Purchase Details
Closed on
Feb 9, 2001
Sold by
River Golf Est Llc
Bought by
Pallman-David Cynthia and David Nigel M
Home Financials for this Owner
Home Financials are based on the most recent Mortgage that was taken out on this home.
Original Mortgage
$246,500
Interest Rate
7.13%
Create a Home Valuation Report for This Property
The Home Valuation Report is an in-depth analysis detailing your home's value as well as a comparison with similar homes in the area
Home Values in the Area
Average Home Value in this Area
Purchase History
| Date | Buyer | Sale Price | Title Company |
|---|---|---|---|
| Udoyen Ubong J | $505,000 | -- | |
| Udoyen Ubong J | $505,000 | -- | |
| David Nigel M | -- | -- | |
| David Nigel M | -- | -- | |
| Pallman-David Cynthia | $400,571 | -- | |
| Pallman-David Cynthia | $400,571 | -- |
Source: Public Records
Mortgage History
| Date | Status | Borrower | Loan Amount |
|---|---|---|---|
| Open | Udoyen Ubong J | $479,750 | |
| Closed | Udoyen Ubong J | $479,750 | |
| Previous Owner | Pallman-David Cynthia | $309,000 | |
| Previous Owner | Pallman-David Cynthia | $246,500 |
Source: Public Records
Tax History Compared to Growth
Tax History
| Year | Tax Paid | Tax Assessment Tax Assessment Total Assessment is a certain percentage of the fair market value that is determined by local assessors to be the total taxable value of land and additions on the property. | Land | Improvement |
|---|---|---|---|---|
| 2025 | $13,057 | $441,870 | $141,160 | $300,710 |
| 2024 | $12,876 | $441,870 | $141,160 | $300,710 |
| 2023 | $12,006 | $441,870 | $141,160 | $300,710 |
| 2022 | $11,776 | $441,870 | $141,160 | $300,710 |
| 2021 | $10,877 | $393,370 | $115,220 | $278,150 |
| 2020 | $10,888 | $393,370 | $115,220 | $278,150 |
| 2019 | $10,900 | $393,370 | $115,220 | $278,150 |
| 2018 | $10,912 | $393,370 | $115,220 | $278,150 |
| 2017 | $10,932 | $393,370 | $115,220 | $278,150 |
| 2016 | $11,033 | $396,300 | $115,220 | $281,080 |
| 2015 | $11,049 | $396,300 | $115,220 | $281,080 |
| 2014 | $10,787 | $396,300 | $115,220 | $281,080 |
Source: Public Records
Map
Nearby Homes
- 183 Centennial Dr
- 164 Centennial Dr
- 26 Myrtlewood Dr
- 161 Herbert St
- 665 River Rd Unit 11
- 918 Wheelers Farms Rd
- 86 Kyles Way Unit 86
- 539 Fairway Rd
- 179 Remy Ct Unit 179
- 184 Kyles Way
- 38 Stowe Dr
- 425 Asbury Ridge Unit 425
- 444 Asbury Ridge
- 88 Rocky Rest Rd
- 35 Mustang Dr
- 8 Noguchi Trail
- 8 Algonkin Rd Unit A
- 35 Saginaw Trail
- 2 Manhassett Trail
- 11 Pueblo Trail