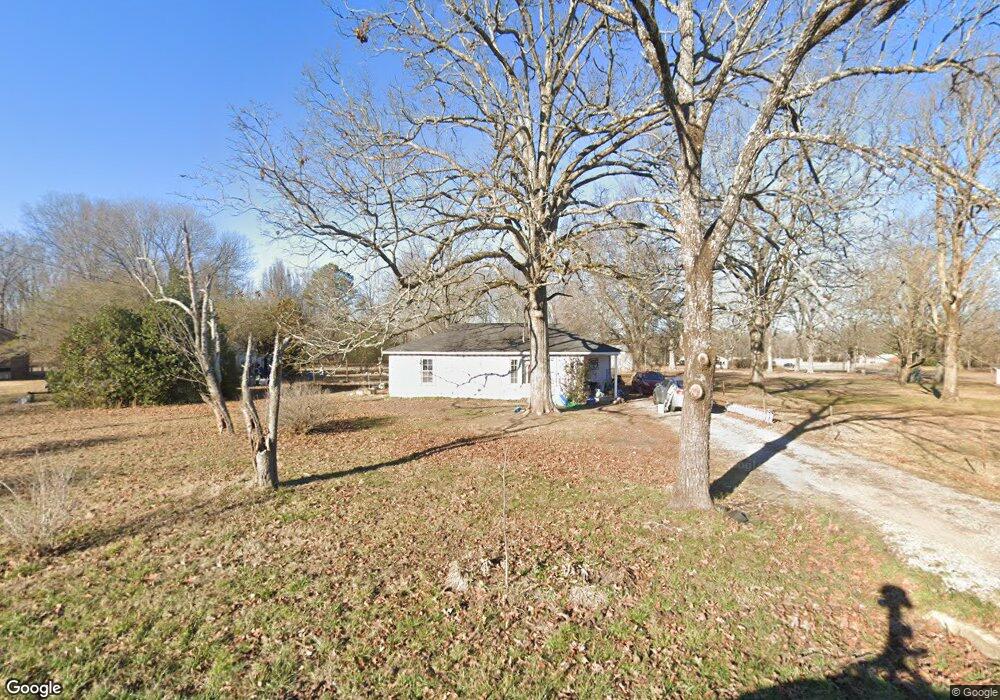
58 Blackburn Ln Tullahoma, TN 37388
Estimated Value: $85,000 - $233,000
--
Bed
1
Bath
963
Sq Ft
$163/Sq Ft
Est. Value
About This Home
This home is located at 58 Blackburn Ln, Tullahoma, TN 37388 and is currently estimated at $156,531, approximately $162 per square foot. 58 Blackburn Ln is a home located in Franklin County with nearby schools including North Middle School, Franklin County High School, and Tullahoma Sda School.
Ownership History
Date
Name
Owned For
Owner Type
Purchase Details
Closed on
Mar 21, 2023
Sold by
Scott C Ann
Bought by
Scott Trevor
Current Estimated Value
Home Financials for this Owner
Home Financials are based on the most recent Mortgage that was taken out on this home.
Original Mortgage
$35,000
Outstanding Balance
$13,635
Interest Rate
6.12%
Mortgage Type
Seller Take Back
Estimated Equity
$142,896
Purchase Details
Closed on
Dec 16, 2016
Sold by
Scott Annie Rae
Bought by
Scott C Ann
Purchase Details
Closed on
Aug 17, 2006
Sold by
Scott Mary V
Bought by
Scott Mary
Purchase Details
Closed on
Oct 19, 2000
Sold by
Rickman John R
Bought by
Scott Mary
Purchase Details
Closed on
Sep 25, 1996
Bought by
Rickman John T and Rickman Barbara W
Purchase Details
Closed on
Jan 8, 1987
Purchase Details
Closed on
Apr 8, 1986
Purchase Details
Closed on
Apr 15, 1977
Purchase Details
Closed on
Nov 21, 1975
Create a Home Valuation Report for This Property
The Home Valuation Report is an in-depth analysis detailing your home's value as well as a comparison with similar homes in the area
Home Values in the Area
Average Home Value in this Area
Purchase History
| Date | Buyer | Sale Price | Title Company |
|---|---|---|---|
| Scott Trevor | $55,000 | Gateway Title Services | |
| Scott Trevor | $55,000 | Gateway Title Services | |
| Scott C Ann | $37,000 | -- | |
| Scott Mary | -- | -- | |
| Scott Mary | $39,000 | -- | |
| Rickman John T | $27,000 | -- | |
| -- | $20,000 | -- | |
| -- | $18,000 | -- | |
| -- | -- | -- | |
| -- | -- | -- |
Source: Public Records
Mortgage History
| Date | Status | Borrower | Loan Amount |
|---|---|---|---|
| Open | Scott Trevor | $35,000 | |
| Closed | Scott Trevor | $35,000 |
Source: Public Records
Tax History Compared to Growth
Tax History
| Year | Tax Paid | Tax Assessment Tax Assessment Total Assessment is a certain percentage of the fair market value that is determined by local assessors to be the total taxable value of land and additions on the property. | Land | Improvement |
|---|---|---|---|---|
| 2024 | $407 | $20,400 | $4,600 | $15,800 |
| 2023 | $407 | $20,400 | $4,600 | $15,800 |
| 2022 | $383 | $20,400 | $4,600 | $15,800 |
| 2021 | $317 | $20,400 | $4,600 | $15,800 |
| 2020 | $317 | $11,025 | $3,275 | $7,750 |
| 2019 | $317 | $11,025 | $3,275 | $7,750 |
| 2018 | $295 | $11,025 | $3,275 | $7,750 |
| 2017 | $295 | $11,025 | $3,275 | $7,750 |
| 2016 | $265 | $9,900 | $3,275 | $6,625 |
| 2015 | $265 | $9,900 | $3,275 | $6,625 |
| 2014 | $265 | $9,899 | $0 | $0 |
Source: Public Records
Map
Nearby Homes
- 5453 Awalt Rd
- 5425 Awalt Rd
- 10831 Old Tullahoma Rd
- 12131 Old Tullahoma Rd
- 0 Chapel Rd Unit RTC2905947
- 74 Holt Ln
- 88 Chapel Rd
- 189 Turkey Creek Dr
- 12986 Old Tullahoma Rd
- 0 Hurricane Rd
- 93 Jean Dr
- 384 Evans Dr
- 108 Wallace Dr
- 343 Jean Dr
- 397 Jean Dr
- 354 Riddle Ln
- 1117 Essie Cleek Rd
- TBD1 Crosslin Ave
- TBD2 Crosslin Ave
- 169 Henley Rd
- 11425 Old Tullahoma Rd
- 11420 Old Tullahoma Rd
- 11442 Old Tullahoma Rd
- 11384 Old Tullahoma Rd
- 11521 Old Tullahoma Rd
- 11281 Old Tullahoma Rd
- 11492 Old Tullahoma Rd
- 181 Blackburn Ln
- 11555 Old Tullahoma Rd
- 11526 Old Tullahoma Rd
- 11255 Old Tullahoma Rd
- 234 Blackburn Ln
- 11546 Old Tullahoma Rd
- 11318 Old Tullahoma Rd
- 11209 Old Tullahoma Rd
- 264 Blackburn Ln
- 11625 Old Tullahoma Rd
- 296 Blackburn Ln
- 283 Blackburn Ln
- 11181 Old Tullahoma Rd