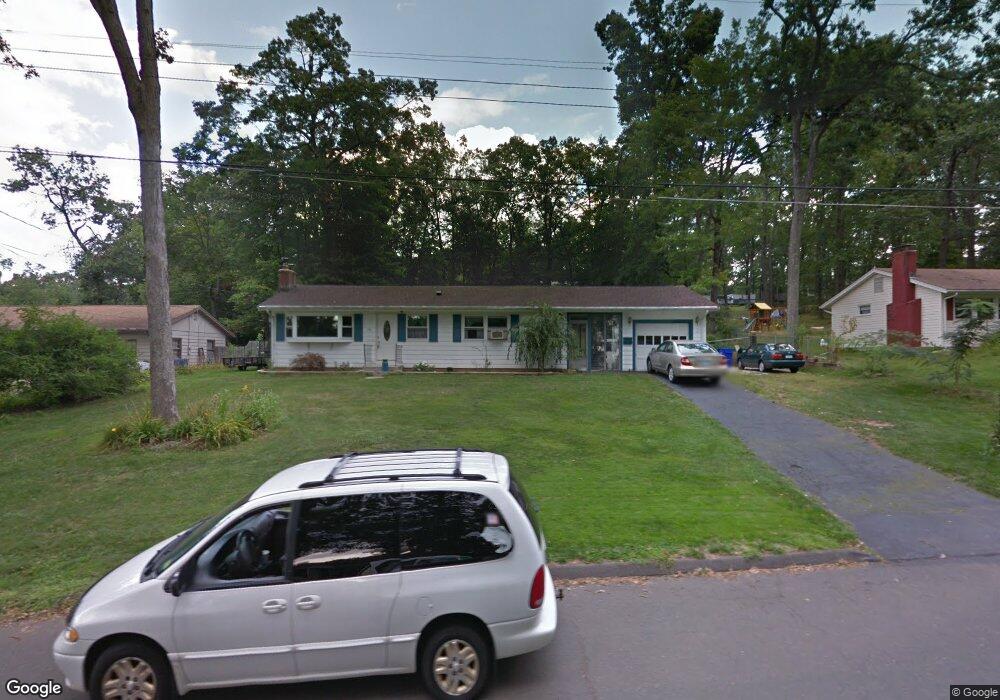
58 Brian Rd South Windsor, CT 06074
Estimated Value: $360,713 - $378,000
3
Beds
2
Baths
1,056
Sq Ft
$351/Sq Ft
Est. Value
About This Home
This home is located at 58 Brian Rd, South Windsor, CT 06074 and is currently estimated at $370,428, approximately $350 per square foot. 58 Brian Rd is a home located in Hartford County with nearby schools including Timothy Edwards School and South Windsor High School.
Ownership History
Date
Name
Owned For
Owner Type
Purchase Details
Closed on
Feb 11, 2010
Sold by
Gineo Amy
Bought by
Gineo Gregory
Current Estimated Value
Home Financials for this Owner
Home Financials are based on the most recent Mortgage that was taken out on this home.
Original Mortgage
$147,500
Outstanding Balance
$97,564
Interest Rate
4.94%
Estimated Equity
$272,864
Purchase Details
Closed on
Mar 31, 1995
Sold by
Frechette Norman Est
Bought by
Gineo Gregory and Gineo Amy
Create a Home Valuation Report for This Property
The Home Valuation Report is an in-depth analysis detailing your home's value as well as a comparison with similar homes in the area
Home Values in the Area
Average Home Value in this Area
Purchase History
| Date | Buyer | Sale Price | Title Company |
|---|---|---|---|
| Gineo Gregory | -- | -- | |
| Gineo Gregory | $109,000 | -- |
Source: Public Records
Mortgage History
| Date | Status | Borrower | Loan Amount |
|---|---|---|---|
| Open | Gineo Gregory | $147,500 | |
| Previous Owner | Gineo Gregory | $31,000 | |
| Previous Owner | Gineo Gregory | $25,000 |
Source: Public Records
Tax History
| Year | Tax Paid | Tax Assessment Tax Assessment Total Assessment is a certain percentage of the fair market value that is determined by local assessors to be the total taxable value of land and additions on the property. | Land | Improvement |
|---|---|---|---|---|
| 2025 | $6,477 | $181,900 | $93,900 | $88,000 |
| 2024 | $6,268 | $181,900 | $93,900 | $88,000 |
| 2023 | $6,028 | $181,900 | $93,900 | $88,000 |
| 2022 | $5,160 | $133,100 | $86,900 | $46,200 |
| 2021 | $5,039 | $133,100 | $86,900 | $46,200 |
| 2020 | $5,042 | $133,100 | $86,900 | $46,200 |
| 2019 | $5,124 | $133,100 | $86,900 | $46,200 |
| 2018 | $5,014 | $133,100 | $86,900 | $46,200 |
| 2017 | $5,198 | $136,500 | $86,900 | $49,600 |
| 2016 | $5,097 | $136,500 | $86,900 | $49,600 |
| 2015 | $4,988 | $136,500 | $86,900 | $49,600 |
| 2014 | $4,847 | $136,500 | $86,900 | $49,600 |
Source: Public Records
Map
Nearby Homes
- 52 Woodland Dr
- 325 Kelly Rd Unit TRLR R19
- 325 Kelly Rd Unit TRLR A6
- 325 Kelly Rd Unit TRLR S9
- 348 Avery St
- 11 Allison Rd
- 49 Deepwood Dr
- 98 Campbell Ave
- 335 Grissom Rd
- 11 Mara Trail
- 33 Imperial Dr
- 10 Devonshire Dr
- 47 Nolan Cir Unit 47
- 37 Vista View Ln Unit 37
- 95 Meadowview Ln
- 183 Phoenix St
- 12 Shady Brook Ln
- 206 Oakland St
- 28 Colgate Dr
- 35 Vincent Cir
Your Personal Tour Guide
Ask me questions while you tour the home.