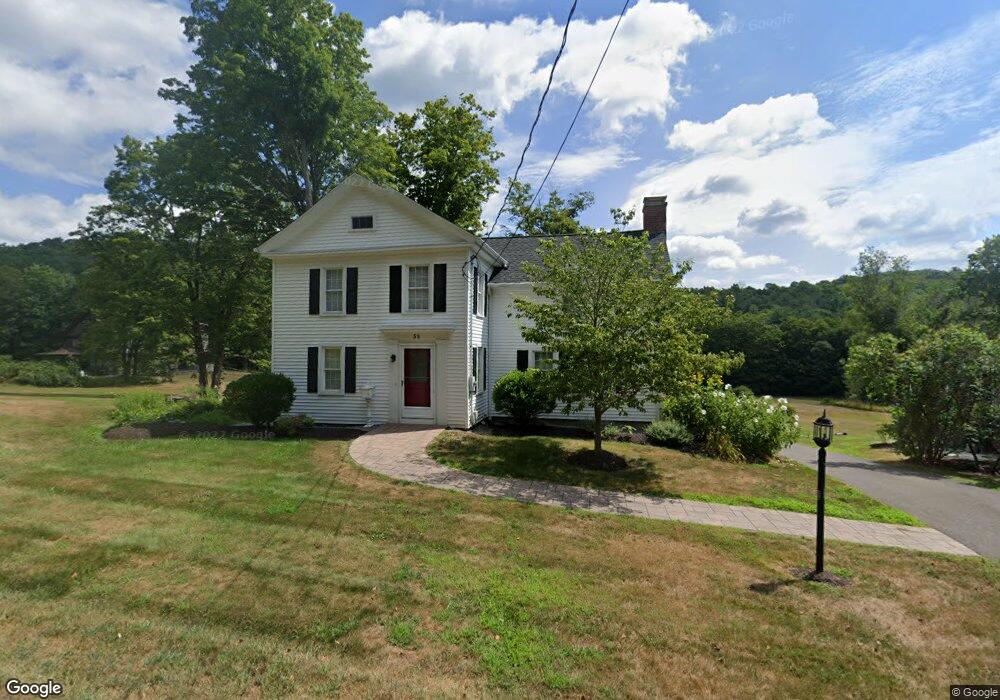
58 Coe St Winsted, CT 06098
Estimated Value: $419,000 - $465,000
3
Beds
4
Baths
2,108
Sq Ft
$209/Sq Ft
Est. Value
About This Home
This home is located at 58 Coe St, Winsted, CT 06098 and is currently estimated at $440,293, approximately $208 per square foot. 58 Coe St is a home located in Litchfield County with nearby schools including Pearson School, Explorations Charter School, and St Anthony School.
Ownership History
Date
Name
Owned For
Owner Type
Purchase Details
Closed on
Mar 11, 2025
Sold by
Manchester George E
Bought by
Shaw Kimberly M and Manchester Jeffrey V
Current Estimated Value
Purchase Details
Closed on
Nov 26, 2013
Sold by
Manchester Judith V
Bought by
Manchester George E
Purchase Details
Closed on
Nov 3, 2010
Sold by
Vaill Stephen G
Bought by
Manchester Judith
Purchase Details
Closed on
Dec 1, 1985
Bought by
Manchester George E
Create a Home Valuation Report for This Property
The Home Valuation Report is an in-depth analysis detailing your home's value as well as a comparison with similar homes in the area
Home Values in the Area
Average Home Value in this Area
Purchase History
| Date | Buyer | Sale Price | Title Company |
|---|---|---|---|
| Shaw Kimberly M | -- | None Available | |
| Shaw Kimberly M | -- | None Available | |
| Manchester George E | -- | -- | |
| Manchester George E | -- | -- | |
| Manchester Judith | -- | -- | |
| Manchester Judith V | -- | -- | |
| Manchester George E | -- | -- |
Source: Public Records
Tax History
| Year | Tax Paid | Tax Assessment Tax Assessment Total Assessment is a certain percentage of the fair market value that is determined by local assessors to be the total taxable value of land and additions on the property. | Land | Improvement |
|---|---|---|---|---|
| 2025 | $8,541 | $292,810 | $32,830 | $259,980 |
| 2024 | $7,791 | $286,020 | $32,830 | $253,190 |
| 2023 | $7,548 | $286,020 | $32,830 | $253,190 |
| 2022 | $6,539 | $194,950 | $23,800 | $171,150 |
| 2021 | $6,745 | $201,110 | $29,960 | $171,150 |
| 2020 | $6,745 | $201,110 | $29,960 | $171,150 |
| 2019 | $6,745 | $201,110 | $29,960 | $171,150 |
| 2018 | $6,745 | $201,110 | $29,960 | $171,150 |
| 2017 | $6,520 | $194,390 | $27,580 | $166,810 |
| 2016 | $6,520 | $194,390 | $27,580 | $166,810 |
| 2015 | $6,357 | $194,390 | $27,580 | $166,810 |
| 2014 | $6,203 | $194,390 | $27,580 | $166,810 |
Source: Public Records
Map
Nearby Homes
Your Personal Tour Guide
Ask me questions while you tour the home.