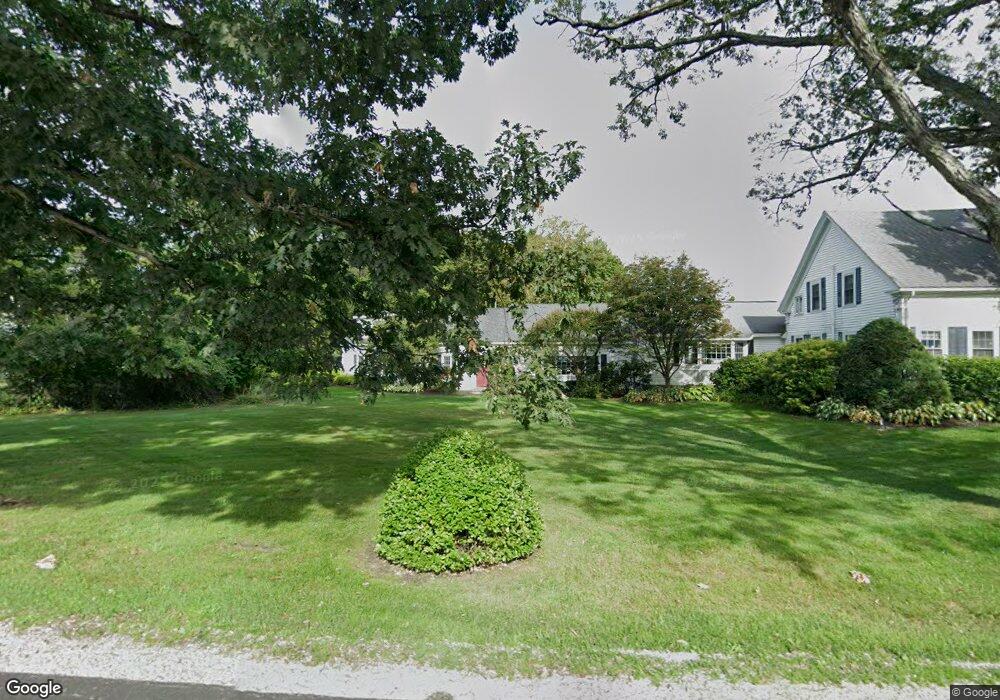
58 Depot Rd Hollis, NH 03049
Hollis NeighborhoodEstimated Value: $1,048,000 - $1,318,824
4
Beds
3
Baths
4,622
Sq Ft
$250/Sq Ft
Est. Value
About This Home
This home is located at 58 Depot Rd, Hollis, NH 03049 and is currently estimated at $1,153,706, approximately $249 per square foot. 58 Depot Rd is a home with nearby schools including Hollis Primary School, Hollis Upper Elementary School, and Hollis-Brookline Middle School.
Ownership History
Date
Name
Owned For
Owner Type
Purchase Details
Closed on
Oct 2, 2014
Sold by
Berry Kristen A
Bought by
Kristen A Berry Ret and Berry Kristen A
Current Estimated Value
Purchase Details
Closed on
Jul 16, 2013
Sold by
Dillon Joseph P
Bought by
Joseph Dillon Ft and Dillon Joseph P
Purchase Details
Closed on
May 20, 1992
Bought by
Kristen A Berry Ret
Create a Home Valuation Report for This Property
The Home Valuation Report is an in-depth analysis detailing your home's value as well as a comparison with similar homes in the area
Home Values in the Area
Average Home Value in this Area
Purchase History
| Date | Buyer | Sale Price | Title Company |
|---|---|---|---|
| Kristen A Berry Ret | -- | -- | |
| Berry Kristen A | -- | -- | |
| Joseph Dillon Ft | -- | -- | |
| Kristen A Berry Ret | -- | -- |
Source: Public Records
Mortgage History
| Date | Status | Borrower | Loan Amount |
|---|---|---|---|
| Previous Owner | Kristen A Berry Ret | $175,000 |
Source: Public Records
Tax History Compared to Growth
Tax History
| Year | Tax Paid | Tax Assessment Tax Assessment Total Assessment is a certain percentage of the fair market value that is determined by local assessors to be the total taxable value of land and additions on the property. | Land | Improvement |
|---|---|---|---|---|
| 2024 | $17,523 | $988,300 | $251,800 | $736,500 |
| 2023 | $16,465 | $988,300 | $251,800 | $736,500 |
| 2022 | $22,306 | $988,300 | $251,800 | $736,500 |
| 2021 | $15,731 | $693,000 | $164,600 | $528,400 |
| 2020 | $16,064 | $693,000 | $164,600 | $528,400 |
| 2019 | $16,008 | $693,000 | $164,600 | $528,400 |
| 2018 | $15,017 | $693,000 | $164,600 | $528,400 |
| 2017 | $6,131 | $553,500 | $155,500 | $398,000 |
| 2016 | $12,969 | $553,500 | $155,500 | $398,000 |
| 2015 | $12,742 | $553,500 | $155,500 | $398,000 |
| 2014 | $12,802 | $553,500 | $155,500 | $398,000 |
| 2013 | $12,631 | $553,500 | $155,500 | $398,000 |
Source: Public Records
Map
Nearby Homes