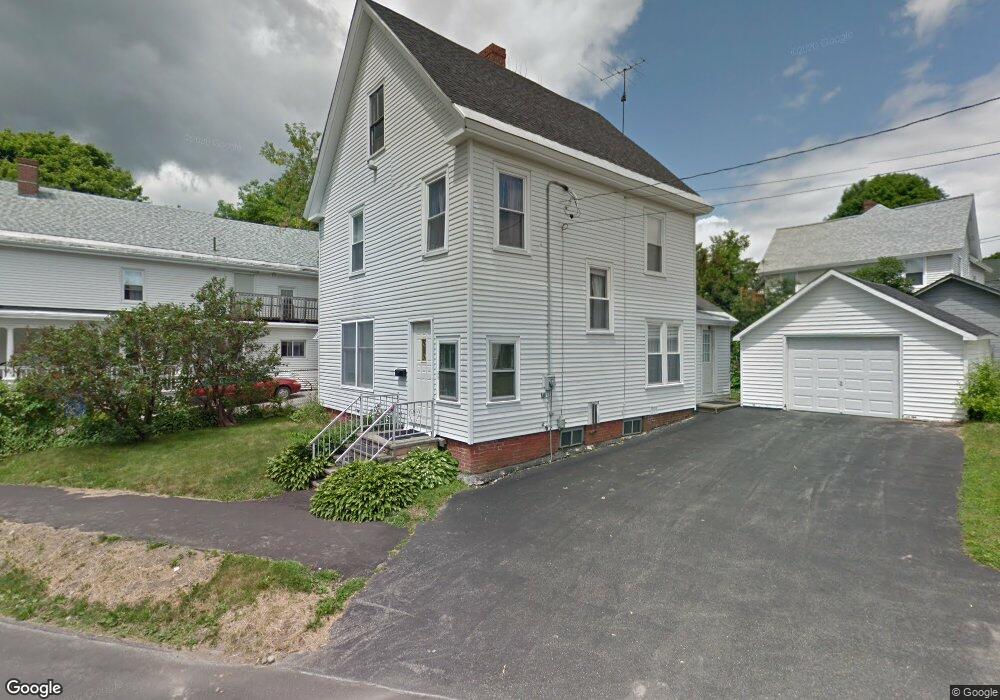
58 Division St Bangor, ME 04401
Little City NeighborhoodEstimated Value: $215,655 - $263,000
4
Beds
1
Bath
1,647
Sq Ft
$140/Sq Ft
Est. Value
About This Home
This home is located at 58 Division St, Bangor, ME 04401 and is currently estimated at $230,914, approximately $140 per square foot. 58 Division St is a home located in Penobscot County with nearby schools including Abraham Lincoln School, Mary Snow School, and William S. Cohen School.
Ownership History
Date
Name
Owned For
Owner Type
Purchase Details
Closed on
Feb 13, 2012
Sold by
Metzger Thomas W and Metzger Benjamin J
Bought by
Metzger Benjamin J and Metzger Elena A
Current Estimated Value
Purchase Details
Closed on
Feb 4, 2011
Sold by
Wong Kam O
Bought by
Metzger Thomas W and Metzger Benjamin J
Home Financials for this Owner
Home Financials are based on the most recent Mortgage that was taken out on this home.
Original Mortgage
$50,000
Outstanding Balance
$34,279
Interest Rate
4.82%
Mortgage Type
Purchase Money Mortgage
Estimated Equity
$196,635
Create a Home Valuation Report for This Property
The Home Valuation Report is an in-depth analysis detailing your home's value as well as a comparison with similar homes in the area
Home Values in the Area
Average Home Value in this Area
Purchase History
| Date | Buyer | Sale Price | Title Company |
|---|---|---|---|
| Metzger Benjamin J | -- | -- | |
| Metzger Thomas W | -- | -- |
Source: Public Records
Mortgage History
| Date | Status | Borrower | Loan Amount |
|---|---|---|---|
| Open | Metzger Thomas W | $50,000 |
Source: Public Records
Tax History Compared to Growth
Tax History
| Year | Tax Paid | Tax Assessment Tax Assessment Total Assessment is a certain percentage of the fair market value that is determined by local assessors to be the total taxable value of land and additions on the property. | Land | Improvement |
|---|---|---|---|---|
| 2024 | $2,979 | $160,600 | $11,300 | $149,300 |
| 2023 | $2,796 | $146,000 | $11,300 | $134,700 |
| 2022 | $2,577 | $126,300 | $11,300 | $115,000 |
| 2021 | $2,348 | $105,300 | $10,400 | $94,900 |
| 2020 | $2,346 | $101,100 | $10,400 | $90,700 |
| 2019 | $2,247 | $97,700 | $10,400 | $87,300 |
| 2018 | $2,222 | $96,800 | $10,700 | $86,100 |
| 2017 | $2,160 | $95,800 | $10,700 | $85,100 |
| 2016 | $2,104 | $93,500 | $10,700 | $82,800 |
| 2015 | $2,052 | $93,500 | $10,700 | $82,800 |
| 2014 | $1,971 | $90,400 | $10,700 | $79,700 |
| 2013 | $1,882 | $90,500 | $10,700 | $79,800 |
Source: Public Records
Map
Nearby Homes
- 17 Prentiss St
- 64 Jefferson St
- 75 S South Park St
- 327 French St
- 290 French St
- 134 Kenduskeag Ave
- 295 French St
- 201 Broadway
- 127 Congress St
- 66 Smith St
- 72 Garland St
- 98 Fountain St
- 230 French St
- TBD Winter St
- 25 Winter St
- 176 Court St
- 345 Broadway
- 112 Franklin St Unit C8
- 363 Broadway
- 64 Thomas Hill Rd