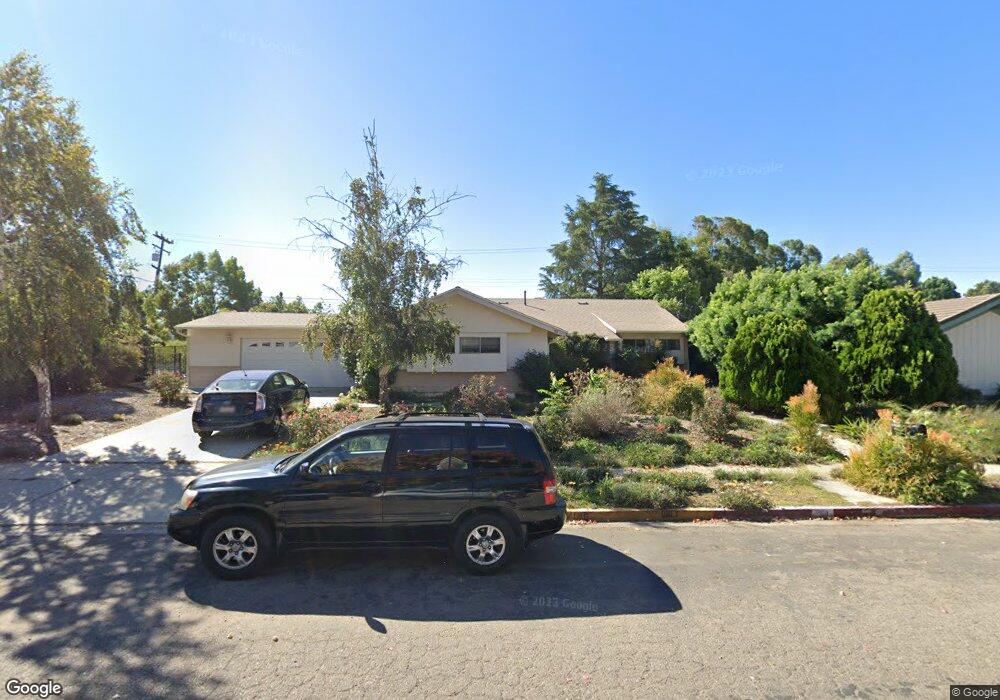
58 Faculty St Thousand Oaks, CA 91360
Estimated Value: $1,039,000 - $1,236,000
4
Beds
3
Baths
2,253
Sq Ft
$504/Sq Ft
Est. Value
About This Home
This home is located at 58 Faculty St, Thousand Oaks, CA 91360 and is currently estimated at $1,134,658, approximately $503 per square foot. 58 Faculty St is a home located in Ventura County with nearby schools including Wildwood Elementary School, Redwood Middle School, and Thousand Oaks High School.
Ownership History
Date
Name
Owned For
Owner Type
Purchase Details
Closed on
Dec 1, 2017
Sold by
Weterback Daryl Walter and Dawson Kelly Janeen
Bought by
Westerback Dary W and Dawson Kelly J
Current Estimated Value
Purchase Details
Closed on
Mar 15, 2004
Sold by
Rollins Nick A and Rollins Lisa A
Bought by
Westerback Daryl Walter and Dawson Kelly Janeen
Home Financials for this Owner
Home Financials are based on the most recent Mortgage that was taken out on this home.
Original Mortgage
$530,000
Outstanding Balance
$233,750
Interest Rate
4.87%
Mortgage Type
New Conventional
Estimated Equity
$900,908
Purchase Details
Closed on
Apr 27, 1999
Sold by
Rollins Nick A and Verhow Lisa A
Bought by
Rollins Nick A and Rollins Lisa A
Home Financials for this Owner
Home Financials are based on the most recent Mortgage that was taken out on this home.
Original Mortgage
$166,300
Interest Rate
6.98%
Create a Home Valuation Report for This Property
The Home Valuation Report is an in-depth analysis detailing your home's value as well as a comparison with similar homes in the area
Purchase History
| Date | Buyer | Sale Price | Title Company |
|---|---|---|---|
| Westerback Dary W | -- | None Available | |
| Westerback Daryl Walter | $662,500 | Ticor Title Company | |
| Rollins Nick A | -- | Stewart Title |
Source: Public Records
Mortgage History
| Date | Status | Borrower | Loan Amount |
|---|---|---|---|
| Open | Westerback Daryl Walter | $530,000 | |
| Previous Owner | Rollins Nick A | $166,300 | |
| Closed | Westerback Daryl Walter | $66,250 |
Source: Public Records
Tax History
| Year | Tax Paid | Tax Assessment Tax Assessment Total Assessment is a certain percentage of the fair market value that is determined by local assessors to be the total taxable value of land and additions on the property. | Land | Improvement |
|---|---|---|---|---|
| 2025 | $10,158 | $941,916 | $639,797 | $302,119 |
| 2024 | $10,158 | $923,448 | $627,252 | $296,196 |
| 2023 | $9,872 | $905,342 | $614,953 | $290,389 |
| 2022 | $9,700 | $887,591 | $602,895 | $284,696 |
| 2021 | $9,536 | $870,188 | $591,074 | $279,114 |
| 2020 | $9,059 | $861,267 | $585,014 | $276,253 |
| 2019 | $8,819 | $844,381 | $573,544 | $270,837 |
| 2018 | $8,196 | $785,000 | $533,000 | $252,000 |
| 2017 | $8,072 | $773,000 | $525,000 | $248,000 |
| 2016 | $7,767 | $736,000 | $500,000 | $236,000 |
| 2015 | $7,432 | $706,000 | $480,000 | $226,000 |
| 2014 | $7,134 | $675,000 | $459,000 | $216,000 |
Source: Public Records
Map
Nearby Homes
- 71 Del Ray Cir
- 205 Cedar Heights Dr
- 2797 Beckett Ct
- 224 Longfellow St
- 416 Camino Dos Palos
- 195 Tennyson St
- 181 W Avenida de Las Flores
- 2839 Trillium St
- 136 Erten St
- 250 W Avenida de Las Flores
- 139 Prentiss St
- 2578 Calle Abedul
- 458 Serento Cir
- 763 E Avenida de Los Arboles
- 285 Siesta Ave
- 334 W Avenida de Las Flores
- 2680 La Paloma Cir
- 2219 Goldsmith Ave
- 190 Lucero St
- 276 Verde Vista Dr
Your Personal Tour Guide
Ask me questions while you tour the home.