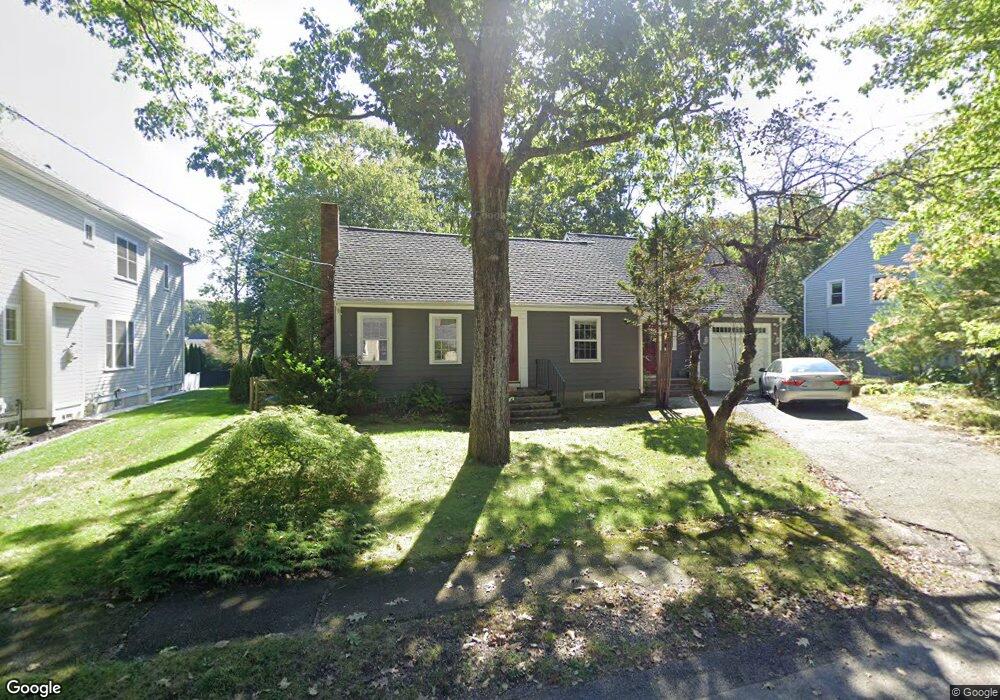
58 Frances St Needham, MA 02492
Estimated Value: $1,660,500
5
Beds
3
Baths
1,544
Sq Ft
$1,075/Sq Ft
Est. Value
About This Home
This home is located at 58 Frances St, Needham, MA 02492 and is currently estimated at $1,660,500, approximately $1,075 per square foot. 58 Frances St is a home located in Norfolk County with nearby schools including Newman Elementary School, High Rock Middle School, and Pollard Middle School.
Ownership History
Date
Name
Owned For
Owner Type
Purchase Details
Closed on
Jan 20, 2017
Sold by
Schindler Peter A and Caulfield Leslie J
Bought by
Schindler Peter A
Current Estimated Value
Purchase Details
Closed on
Jul 20, 1994
Sold by
Knowlton Thomas A
Bought by
Schindler Peter A
Purchase Details
Closed on
Apr 25, 1991
Sold by
Salt Michael A
Bought by
Knowlton Thomas A
Purchase Details
Closed on
Dec 30, 1988
Sold by
Johnson T Terrell R
Bought by
Salt Michael A
Create a Home Valuation Report for This Property
The Home Valuation Report is an in-depth analysis detailing your home's value as well as a comparison with similar homes in the area
Home Values in the Area
Average Home Value in this Area
Purchase History
| Date | Buyer | Sale Price | Title Company |
|---|---|---|---|
| Schindler Peter A | -- | -- | |
| Schindler Peter A | -- | -- | |
| Schindler Peter A | $241,000 | -- | |
| Schindler Peter A | $241,000 | -- | |
| Knowlton Thomas A | $215,000 | -- | |
| Knowlton Thomas A | $215,000 | -- | |
| Salt Michael A | $229,000 | -- |
Source: Public Records
Mortgage History
| Date | Status | Borrower | Loan Amount |
|---|---|---|---|
| Previous Owner | Salt Michael A | $388,000 | |
| Previous Owner | Salt Michael A | $186,500 |
Source: Public Records
Tax History
| Year | Tax Paid | Tax Assessment Tax Assessment Total Assessment is a certain percentage of the fair market value that is determined by local assessors to be the total taxable value of land and additions on the property. | Land | Improvement |
|---|---|---|---|---|
| 2025 | $12,897 | $1,216,700 | $811,400 | $405,300 |
| 2024 | $11,198 | $894,400 | $514,600 | $379,800 |
| 2023 | $11,281 | $865,100 | $514,600 | $350,500 |
| 2022 | $10,816 | $809,000 | $473,000 | $336,000 |
| 2021 | $10,541 | $809,000 | $473,000 | $336,000 |
| 2020 | $10,261 | $821,500 | $473,000 | $348,500 |
| 2019 | $9,610 | $775,600 | $430,900 | $344,700 |
| 2018 | $9,214 | $775,600 | $430,900 | $344,700 |
| 2017 | $8,689 | $730,800 | $430,900 | $299,900 |
| 2016 | $8,472 | $734,100 | $430,900 | $303,200 |
| 2015 | $8,288 | $734,100 | $430,900 | $303,200 |
| 2014 | $7,805 | $670,500 | $376,000 | $294,500 |
Source: Public Records
Map
Nearby Homes
- 95 Deerfield Rd
- 189 Bridle Trail Rd
- 287 High Rock St
- 620 High Rock St
- 47 Emerson Rd
- 73 Maple St Unit 1
- 569 Chestnut St
- 37 Carleton Dr
- 34 Stratford Rd
- 957 South St
- 52 Hancock Rd
- 90 Norfolk St
- 24 Moseley Ave
- 8 Crestview Rd
- 233 Warren St
- 193 Garden St
- 150 Laurel Dr
- 68 Pleasant St Unit 68
- 3 Hancock Rd
- 1780 Central Ave
Your Personal Tour Guide
Ask me questions while you tour the home.