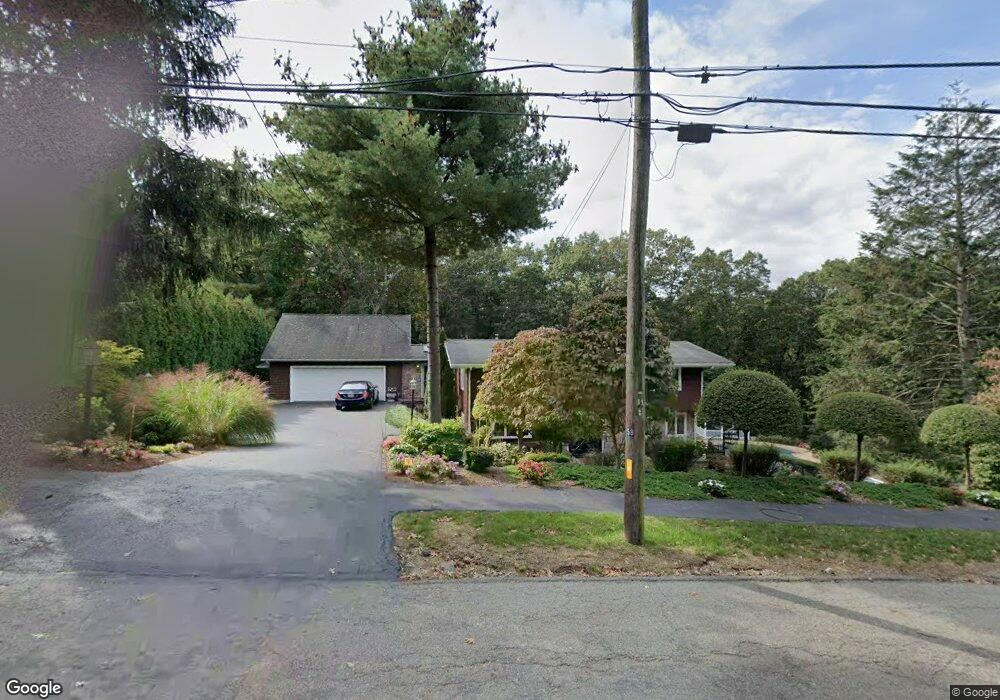
58 Leslie Rd Waltham, MA 02451
North Waltham NeighborhoodEstimated Value: $1,324,281 - $1,522,000
4
Beds
3
Baths
4,667
Sq Ft
$306/Sq Ft
Est. Value
About This Home
This home is located at 58 Leslie Rd, Waltham, MA 02451 and is currently estimated at $1,427,820, approximately $305 per square foot. 58 Leslie Rd is a home located in Middlesex County with nearby schools including Douglas Macarthur Elementary School, John F Kennedy Middle School, and Waltham Sr High School.
Ownership History
Date
Name
Owned For
Owner Type
Purchase Details
Closed on
Jun 28, 1996
Sold by
Leavitt Maurice J and Leavitt Ellen B
Bought by
Labossiere Michelle L
Current Estimated Value
Home Financials for this Owner
Home Financials are based on the most recent Mortgage that was taken out on this home.
Original Mortgage
$178,400
Interest Rate
8.05%
Mortgage Type
Purchase Money Mortgage
Create a Home Valuation Report for This Property
The Home Valuation Report is an in-depth analysis detailing your home's value as well as a comparison with similar homes in the area
Home Values in the Area
Average Home Value in this Area
Purchase History
| Date | Buyer | Sale Price | Title Company |
|---|---|---|---|
| Labossiere Michelle L | $223,000 | -- |
Source: Public Records
Mortgage History
| Date | Status | Borrower | Loan Amount |
|---|---|---|---|
| Open | Labossiere Michelle L | $10,000 | |
| Open | Labossiere Michelle L | $182,000 | |
| Closed | Labossiere Michelle L | $178,400 |
Source: Public Records
Tax History Compared to Growth
Tax History
| Year | Tax Paid | Tax Assessment Tax Assessment Total Assessment is a certain percentage of the fair market value that is determined by local assessors to be the total taxable value of land and additions on the property. | Land | Improvement |
|---|---|---|---|---|
| 2025 | $10,091 | $1,027,600 | $530,100 | $497,500 |
| 2024 | $9,596 | $995,400 | $505,100 | $490,300 |
| 2023 | $9,693 | $939,200 | $460,100 | $479,100 |
| 2022 | $10,052 | $902,300 | $440,100 | $462,200 |
| 2021 | $9,535 | $842,300 | $440,100 | $402,200 |
| 2020 | $9,865 | $825,500 | $410,100 | $415,400 |
| 2019 | $10,400 | $821,500 | $406,100 | $415,400 |
| 2018 | $9,538 | $756,400 | $376,100 | $380,300 |
| 2017 | $8,985 | $715,400 | $335,100 | $380,300 |
| 2016 | $8,144 | $665,400 | $285,100 | $380,300 |
| 2015 | $8,834 | $672,800 | $285,100 | $387,700 |
Source: Public Records
Map
Nearby Homes