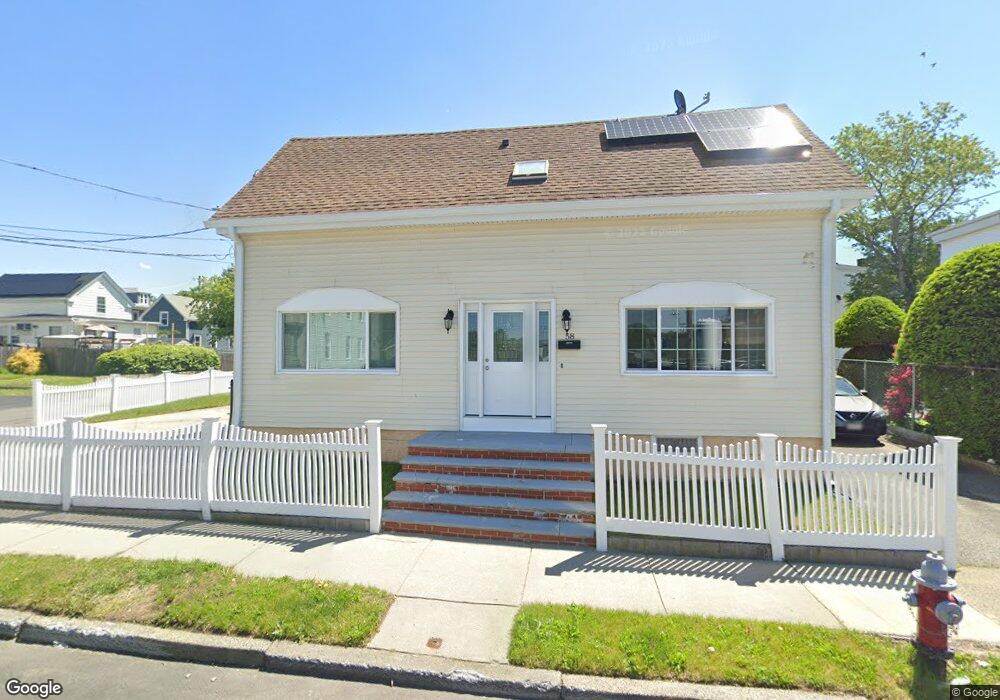
58 Linden St Lynn, MA 01905
West Lynn NeighborhoodEstimated Value: $465,000 - $522,862
3
Beds
2
Baths
1,411
Sq Ft
$353/Sq Ft
Est. Value
About This Home
This home is located at 58 Linden St, Lynn, MA 01905 and is currently estimated at $498,216, approximately $353 per square foot. 58 Linden St is a home located in Essex County with nearby schools including Drewicz Elementary School, William R. Fallon School, and Breed Middle School.
Ownership History
Date
Name
Owned For
Owner Type
Purchase Details
Closed on
Dec 8, 2004
Sold by
Mercado Oscar
Bought by
Mercado Ketty
Current Estimated Value
Purchase Details
Closed on
Jul 1, 1993
Sold by
Meridian Mtg Corp
Bought by
Mercado Oscar and Mercado Ketty
Purchase Details
Closed on
Feb 23, 1993
Sold by
Toner Arthur A
Bought by
Meridian Mtg Corp
Purchase Details
Closed on
Jul 19, 1988
Sold by
Renaud David W
Bought by
Toner Arthur A
Create a Home Valuation Report for This Property
The Home Valuation Report is an in-depth analysis detailing your home's value as well as a comparison with similar homes in the area
Home Values in the Area
Average Home Value in this Area
Purchase History
| Date | Buyer | Sale Price | Title Company |
|---|---|---|---|
| Mercado Ketty | $30,000 | -- | |
| Mercado Ketty | $30,000 | -- | |
| Mercado Oscar | $59,500 | -- | |
| Mercado Oscar | $59,500 | -- | |
| Meridian Mtg Corp | $42,700 | -- | |
| Meridian Mtg Corp | $42,700 | -- | |
| Toner Arthur A | $127,000 | -- |
Source: Public Records
Mortgage History
| Date | Status | Borrower | Loan Amount |
|---|---|---|---|
| Open | Toner Arthur A | $216,000 | |
| Closed | Toner Arthur A | $40,000 |
Source: Public Records
Tax History
| Year | Tax Paid | Tax Assessment Tax Assessment Total Assessment is a certain percentage of the fair market value that is determined by local assessors to be the total taxable value of land and additions on the property. | Land | Improvement |
|---|---|---|---|---|
| 2025 | $5,155 | $497,600 | $196,200 | $301,400 |
| 2024 | $4,891 | $464,500 | $180,300 | $284,200 |
| 2023 | $4,553 | $408,300 | $160,600 | $247,700 |
| 2022 | $4,610 | $370,900 | $150,900 | $220,000 |
| 2021 | $4,288 | $329,100 | $124,500 | $204,600 |
| 2020 | $3,909 | $291,700 | $104,000 | $187,700 |
| 2019 | $3,797 | $265,500 | $89,300 | $176,200 |
| 2018 | $3,691 | $243,600 | $97,700 | $145,900 |
| 2017 | $3,483 | $223,300 | $86,400 | $136,900 |
| 2016 | $3,408 | $210,600 | $81,800 | $128,800 |
| 2015 | $3,047 | $181,900 | $70,400 | $111,500 |
Source: Public Records
Map
Nearby Homes
Your Personal Tour Guide
Ask me questions while you tour the home.