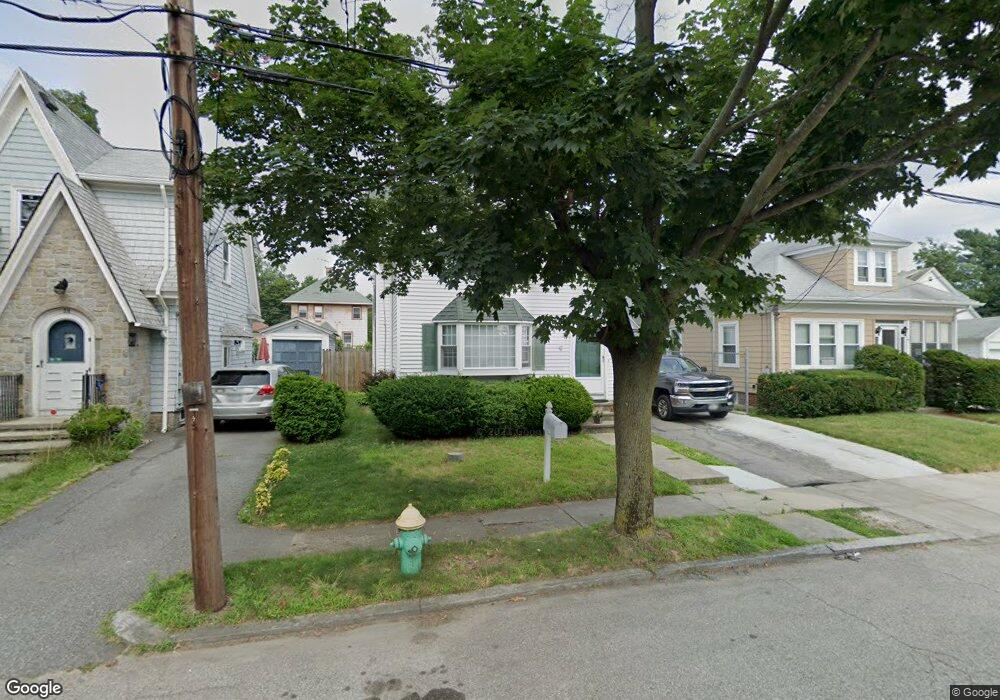
58 Lyndon Rd Cranston, RI 02905
Edgewood NeighborhoodEstimated Value: $419,480 - $449,000
3
Beds
2
Baths
2,132
Sq Ft
$205/Sq Ft
Est. Value
About This Home
This home is located at 58 Lyndon Rd, Cranston, RI 02905 and is currently estimated at $437,120, approximately $205 per square foot. 58 Lyndon Rd is a home located in Providence County with nearby schools including Edgewood Highland Elementary School, Edward S. Rhodes School, and Park View Middle School.
Ownership History
Date
Name
Owned For
Owner Type
Purchase Details
Closed on
Feb 20, 2004
Sold by
Belluscio 3Rd James and Belluscio Dale
Bought by
Coletti Kristin
Current Estimated Value
Home Financials for this Owner
Home Financials are based on the most recent Mortgage that was taken out on this home.
Original Mortgage
$132,000
Interest Rate
5.83%
Mortgage Type
Purchase Money Mortgage
Purchase Details
Closed on
Feb 26, 1997
Sold by
Rachiele Donald A and Rachiele Lillian
Bought by
Belluscio James F and Belluscio Dale
Create a Home Valuation Report for This Property
The Home Valuation Report is an in-depth analysis detailing your home's value as well as a comparison with similar homes in the area
Home Values in the Area
Average Home Value in this Area
Purchase History
| Date | Buyer | Sale Price | Title Company |
|---|---|---|---|
| Coletti Kristin | $165,000 | -- | |
| Belluscio James F | $90,000 | -- |
Source: Public Records
Mortgage History
| Date | Status | Borrower | Loan Amount |
|---|---|---|---|
| Open | Belluscio James F | $168,750 | |
| Closed | Belluscio James F | $40,000 | |
| Closed | Belluscio James F | $132,000 | |
| Previous Owner | Belluscio James F | $106,250 |
Source: Public Records
Tax History Compared to Growth
Tax History
| Year | Tax Paid | Tax Assessment Tax Assessment Total Assessment is a certain percentage of the fair market value that is determined by local assessors to be the total taxable value of land and additions on the property. | Land | Improvement |
|---|---|---|---|---|
| 2025 | $4,866 | $350,600 | $102,500 | $248,100 |
| 2024 | $4,772 | $350,600 | $102,500 | $248,100 |
| 2023 | $4,699 | $248,600 | $67,500 | $181,100 |
| 2022 | $4,589 | $247,900 | $67,500 | $180,400 |
| 2021 | $4,462 | $247,900 | $67,500 | $180,400 |
| 2020 | $4,349 | $209,400 | $64,300 | $145,100 |
| 2019 | $4,349 | $209,400 | $64,300 | $145,100 |
| 2018 | $4,249 | $209,400 | $64,300 | $145,100 |
| 2017 | $4,044 | $176,300 | $57,900 | $118,400 |
| 2016 | $3,958 | $176,300 | $57,900 | $118,400 |
| 2015 | $3,958 | $176,300 | $57,900 | $118,400 |
| 2014 | $3,892 | $170,400 | $57,900 | $112,500 |
Source: Public Records
Map
Nearby Homes