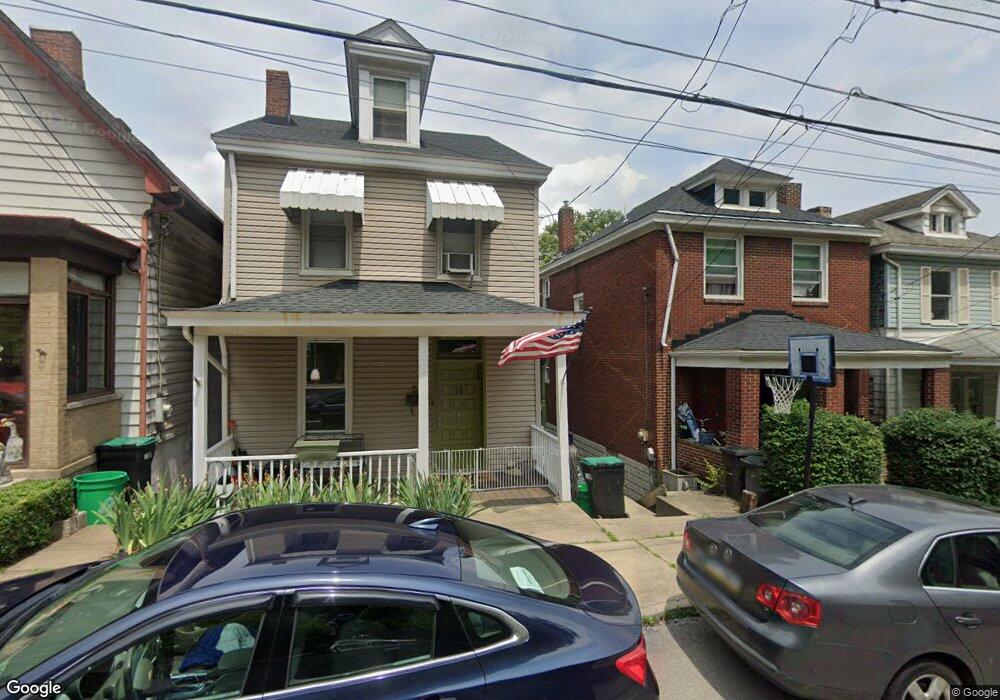
58 Maplewood St Pittsburgh, PA 15223
Estimated Value: $158,000 - $182,162
2
Beds
2
Baths
1,296
Sq Ft
$132/Sq Ft
Est. Value
About This Home
This home is located at 58 Maplewood St, Pittsburgh, PA 15223 and is currently estimated at $170,791, approximately $131 per square foot. 58 Maplewood St is a home located in Allegheny County with nearby schools including Marzolf Primary School, Shaler Area Elementary School, and Shaler Area Middle School.
Ownership History
Date
Name
Owned For
Owner Type
Purchase Details
Closed on
Oct 22, 2009
Sold by
Lafrance James and Lafrance Karen Cherry
Bought by
Giger Beth M and Giger Charles A
Current Estimated Value
Home Financials for this Owner
Home Financials are based on the most recent Mortgage that was taken out on this home.
Original Mortgage
$73,542
Outstanding Balance
$47,973
Interest Rate
5.06%
Mortgage Type
FHA
Estimated Equity
$122,818
Purchase Details
Closed on
Aug 16, 1996
Sold by
Jacob Paul O and Jacob Carol A
Bought by
Cherry Karen
Create a Home Valuation Report for This Property
The Home Valuation Report is an in-depth analysis detailing your home's value as well as a comparison with similar homes in the area
Home Values in the Area
Average Home Value in this Area
Purchase History
| Date | Buyer | Sale Price | Title Company |
|---|---|---|---|
| Giger Beth M | $74,900 | -- | |
| Cherry Karen | $57,800 | -- |
Source: Public Records
Mortgage History
| Date | Status | Borrower | Loan Amount |
|---|---|---|---|
| Open | Giger Beth M | $73,542 |
Source: Public Records
Tax History
| Year | Tax Paid | Tax Assessment Tax Assessment Total Assessment is a certain percentage of the fair market value that is determined by local assessors to be the total taxable value of land and additions on the property. | Land | Improvement |
|---|---|---|---|---|
| 2025 | $2,537 | $66,000 | $17,300 | $48,700 |
| 2024 | $2,537 | $66,000 | $17,300 | $48,700 |
| 2023 | $2,459 | $66,000 | $17,300 | $48,700 |
| 2022 | $2,459 | $66,000 | $17,300 | $48,700 |
| 2021 | $312 | $66,000 | $17,300 | $48,700 |
| 2020 | $2,459 | $66,000 | $17,300 | $48,700 |
| 2019 | $2,459 | $66,000 | $17,300 | $48,700 |
| 2017 | $2,346 | $66,000 | $17,300 | $48,700 |
Source: Public Records
Map
Nearby Homes
- 617 Butler St
- 621 Butler St
- 78 High St
- 24 High St
- 22 James St
- 6 S Spring St
- 17 Locust St
- 8 Butterfield Ave
- 89 Cherry St
- 317 Mount Vernon Dr
- 70 Vilsack St
- 102 Dewey Avenue Extension
- 102 N Main St
- 19B Bethany Dr
- 15 Elizabeth St
- 304 Pilgrim Way
- 146 Buckeye Way
- 137 Vista St
- 301 8th St
- 226 8th St Unit 224
- 56 Maplewood St
- 60 Maplewood St
- 54 Maplewood St
- 64 Maplewood St
- 52 Maplewood St
- 50 Maplewood St Unit 1
- 50 Maplewood St Unit 2
- 50 Maplewood St
- 45 Pine St
- 66 Maplewood St
- 47 Pine St
- 53 Maplewood St
- 41 Pine St
- 48 Maplewood St
- 57 Maplewood St
- 46 Maplewood St
- 59 Maplewood St
- 70 Maplewood St
- 51 Pine St
- 61 Maplewood St
Your Personal Tour Guide
Ask me questions while you tour the home.