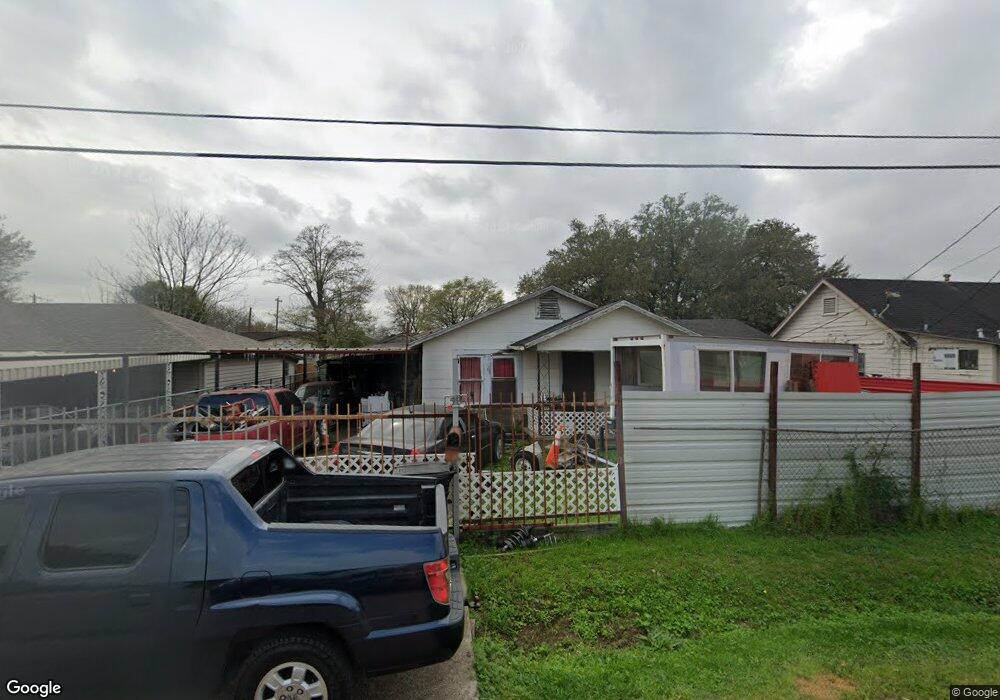
58 Neyland St Houston, TX 77022
Northside-Northline NeighborhoodEstimated Value: $201,000 - $293,000
3
Beds
2
Baths
1,330
Sq Ft
$184/Sq Ft
Est. Value
About This Home
This home is located at 58 Neyland St, Houston, TX 77022 and is currently estimated at $244,417, approximately $183 per square foot. 58 Neyland St is a home located in Harris County with nearby schools including Herrera Elementary School, Burbank Middle School, and Sam Houston Math, Science & Technology Center.
Ownership History
Date
Name
Owned For
Owner Type
Purchase Details
Closed on
Nov 21, 2019
Sold by
Gomez Yeny Rosibel Ramos
Bought by
Robledo Roberto S
Current Estimated Value
Purchase Details
Closed on
Mar 22, 2011
Sold by
Robledo Roberto Santos
Bought by
Robledo Roberto Santos and Robledo Roberto A
Purchase Details
Closed on
Jul 13, 2002
Sold by
Garcia Ignacio and Garcia Mary O
Bought by
Robledo Roberto Santos
Home Financials for this Owner
Home Financials are based on the most recent Mortgage that was taken out on this home.
Original Mortgage
$50,000
Interest Rate
6.76%
Mortgage Type
Seller Take Back
Create a Home Valuation Report for This Property
The Home Valuation Report is an in-depth analysis detailing your home's value as well as a comparison with similar homes in the area
Home Values in the Area
Average Home Value in this Area
Purchase History
| Date | Buyer | Sale Price | Title Company |
|---|---|---|---|
| Robledo Roberto S | -- | None Available | |
| Robledo Roberto Santos | -- | None Available | |
| Robledo Roberto Santos | -- | -- |
Source: Public Records
Mortgage History
| Date | Status | Borrower | Loan Amount |
|---|---|---|---|
| Previous Owner | Robledo Roberto Santos | $50,000 |
Source: Public Records
Tax History Compared to Growth
Tax History
| Year | Tax Paid | Tax Assessment Tax Assessment Total Assessment is a certain percentage of the fair market value that is determined by local assessors to be the total taxable value of land and additions on the property. | Land | Improvement |
|---|---|---|---|---|
| 2025 | $1,324 | $159,056 | $93,500 | $65,556 |
| 2024 | $1,324 | $154,139 | $93,500 | $60,639 |
| 2023 | $1,324 | $151,963 | $81,125 | $70,838 |
| 2022 | $2,380 | $122,267 | $60,500 | $61,767 |
| 2021 | $2,290 | $110,157 | $60,500 | $49,657 |
| 2020 | $2,163 | $105,924 | $60,500 | $45,424 |
| 2019 | $2,411 | $95,287 | $49,500 | $45,787 |
| 2018 | $1,868 | $73,820 | $34,375 | $39,445 |
| 2017 | $1,867 | $73,820 | $34,375 | $39,445 |
| 2016 | $1,867 | $73,820 | $34,375 | $39,445 |
| 2015 | $1,633 | $70,295 | $27,500 | $42,795 |
| 2014 | $1,633 | $63,541 | $19,250 | $44,291 |
Source: Public Records
Map
Nearby Homes
- 65 Neyland St
- 105 Oddo St
- 136 Theron St
- 7014 Finn St
- 7018 Finn St
- 715 E 34th St
- 0 E 31st St Unit 75519178
- 0 W Hardy St Unit 97848877
- 0 W Hardy St Unit 80694202
- 3111 Eastman St
- 164 Wallace St
- 210 Van Molan St
- 0 Yorkshire St Unit 17401015
- 7111 Bauman Rd
- 249 Basswood St
- 7009 Amber St
- 1230 Johnston St
- 1224 Johnston St
- 1228 Johnston St
- 4402 Airline Dr