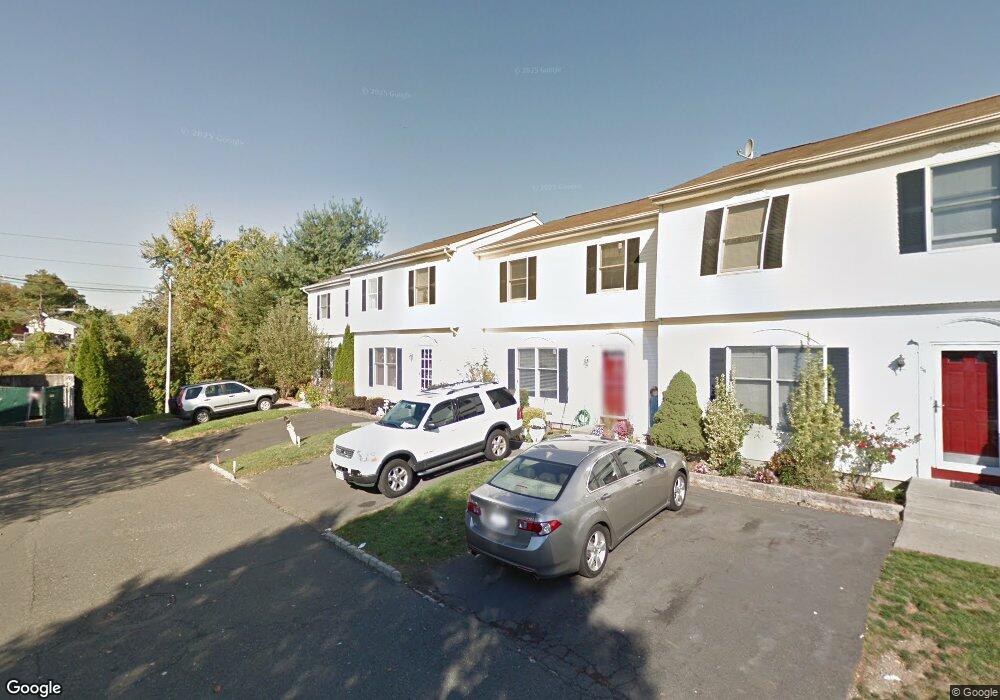
58 Ossman Ct Garnerville, NY 10923
Estimated Value: $274,000 - $437,000
2
Beds
2
Baths
1,350
Sq Ft
$282/Sq Ft
Est. Value
About This Home
This home is located at 58 Ossman Ct, Garnerville, NY 10923 and is currently estimated at $380,596, approximately $281 per square foot. 58 Ossman Ct is a home located in Rockland County with nearby schools including Thiells Elementary School, Willow Grove Middle School, and Fieldstone Secondary School.
Ownership History
Date
Name
Owned For
Owner Type
Purchase Details
Closed on
Oct 14, 1997
Sold by
Ferguson John and Ferguson Susan
Bought by
Ramirez Doreen M
Current Estimated Value
Home Financials for this Owner
Home Financials are based on the most recent Mortgage that was taken out on this home.
Original Mortgage
$100,000
Outstanding Balance
$16,080
Interest Rate
7.46%
Mortgage Type
Construction
Estimated Equity
$364,516
Create a Home Valuation Report for This Property
The Home Valuation Report is an in-depth analysis detailing your home's value as well as a comparison with similar homes in the area
Home Values in the Area
Average Home Value in this Area
Purchase History
| Date | Buyer | Sale Price | Title Company |
|---|---|---|---|
| Ramirez Doreen M | $131,000 | -- |
Source: Public Records
Mortgage History
| Date | Status | Borrower | Loan Amount |
|---|---|---|---|
| Open | Ramirez Doreen M | $100,000 |
Source: Public Records
Tax History
| Year | Tax Paid | Tax Assessment Tax Assessment Total Assessment is a certain percentage of the fair market value that is determined by local assessors to be the total taxable value of land and additions on the property. | Land | Improvement |
|---|---|---|---|---|
| 2024 | $16,047 | $228,500 | $66,800 | $161,700 |
| 2023 | $16,047 | $228,500 | $66,800 | $161,700 |
| 2022 | $15,950 | $228,500 | $66,800 | $161,700 |
| 2021 | $15,874 | $228,500 | $66,800 | $161,700 |
| 2020 | $10,326 | $228,500 | $66,800 | $161,700 |
| 2019 | $2,335 | $228,500 | $66,800 | $161,700 |
| 2018 | $10,007 | $228,500 | $66,800 | $161,700 |
| 2017 | $9,361 | $228,500 | $66,800 | $161,700 |
| 2016 | $9,372 | $228,500 | $66,800 | $161,700 |
| 2015 | -- | $228,500 | $66,800 | $161,700 |
| 2014 | -- | $228,500 | $66,800 | $161,700 |
Source: Public Records
Map
Nearby Homes
Your Personal Tour Guide
Ask me questions while you tour the home.