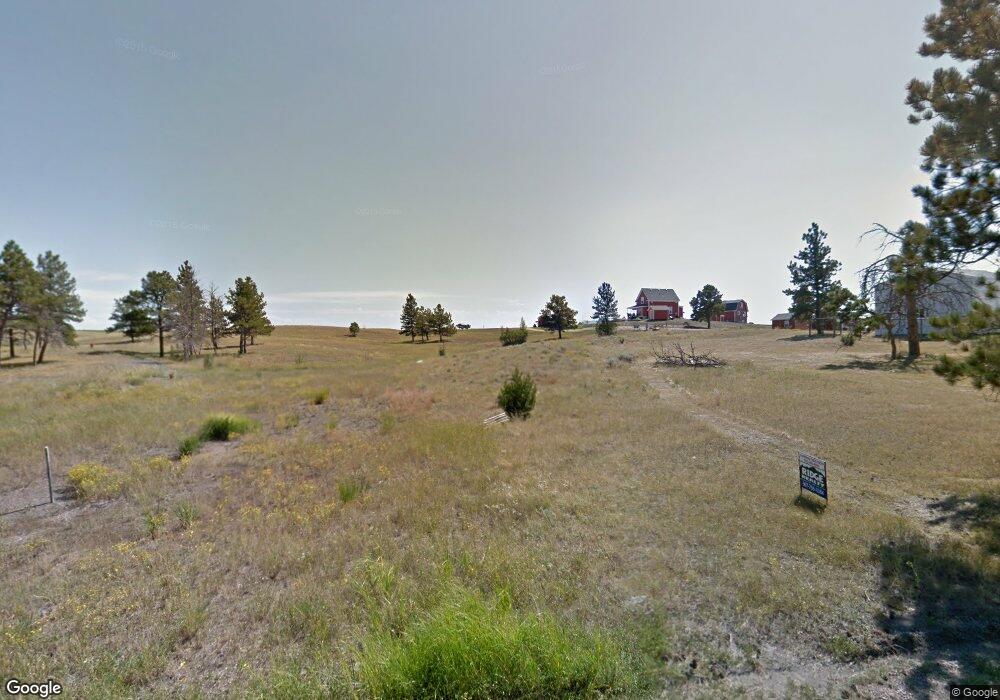
58 Pendleton Dr Pine Haven, WY 82721
Estimated Value: $306,000 - $373,000
2
Beds
2
Baths
1,013
Sq Ft
$339/Sq Ft
Est. Value
About This Home
This home is located at 58 Pendleton Dr, Pine Haven, WY 82721 and is currently estimated at $343,663, approximately $339 per square foot. 58 Pendleton Dr is a home located in Crook County with nearby schools including Hulett School, Bear Lodge High School, and Moorcroft High School.
Ownership History
Date
Name
Owned For
Owner Type
Purchase Details
Closed on
Dec 21, 2023
Sold by
Heritage Properties Llc
Bought by
Mowery Kacey M
Current Estimated Value
Purchase Details
Closed on
Dec 15, 2023
Sold by
Daniels Jared
Bought by
Warne Ryan and Warne Sarah
Purchase Details
Closed on
Nov 28, 2023
Sold by
Myers Kent Alan and Myers Kelly Jo
Bought by
Kent A Myers And Kelly J Myers Living Trust and Myers
Purchase Details
Closed on
Apr 12, 2023
Sold by
Goodnough Ryne and Goodnough Elizabeth
Bought by
Daniels Jared
Home Financials for this Owner
Home Financials are based on the most recent Mortgage that was taken out on this home.
Original Mortgage
$221,874
Interest Rate
6.65%
Mortgage Type
Credit Line Revolving
Create a Home Valuation Report for This Property
The Home Valuation Report is an in-depth analysis detailing your home's value as well as a comparison with similar homes in the area
Purchase History
| Date | Buyer | Sale Price | Title Company |
|---|---|---|---|
| Mowery Kacey M | -- | None Listed On Document | |
| Double T Ventures Llc | -- | None Listed On Document | |
| Warne Ryan | -- | None Listed On Document | |
| Kent A Myers And Kelly J Myers Living Trust | -- | None Listed On Document | |
| Daniels Jared | -- | None Listed On Document |
Source: Public Records
Mortgage History
| Date | Status | Borrower | Loan Amount |
|---|---|---|---|
| Previous Owner | Daniels Jared | $221,874 |
Source: Public Records
Tax History
| Year | Tax Paid | Tax Assessment Tax Assessment Total Assessment is a certain percentage of the fair market value that is determined by local assessors to be the total taxable value of land and additions on the property. | Land | Improvement |
|---|---|---|---|---|
| 2025 | $267 | $19,156 | $3,863 | $15,293 |
| 2024 | $267 | $26,536 | $4,953 | $21,583 |
| 2023 | $216 | $3,793 | $3,793 | $0 |
| 2022 | $216 | $3,070 | $3,070 | $0 |
| 2021 | $201 | $2,851 | $2,851 | $0 |
| 2020 | $229 | $3,252 | $3,252 | $0 |
| 2019 | -- | $3,427 | $3,427 | $0 |
| 2018 | $0 | $3,305 | $3,305 | $0 |
| 2017 | $0 | $3,302 | $3,302 | $0 |
| 2016 | -- | $3,302 | $3,302 | $0 |
| 2015 | -- | $1,827 | $1,827 | $0 |
| 2014 | -- | $1,827 | $1,827 | $0 |
Source: Public Records
Map
Nearby Homes
- Tbd Empire Dr
- 71 Pendleton Dr
- 33 Pendleton Dr
- 25 Pendleton Dr
- 10 Freedom Dr W
- 4 Freedom Dr W
- 9 Big Buck Dr
- 14 Freedom Dr W
- 13 Freedom Dr W
- 21 Freedom Dr W
- 3 Freedom Dr W
- 17 Freedom Dr W
- 18 Freedom Dr W
- 5 Freedom Dr E
- 16 Pine Crest Dr
- 20 Pine Crest Dr
- 4 Freedom Dr E
- 9 Freedom Dr E
- 4 Pine Crest Dr
- 13 Freedom Dr E
- 59 Pendleton Dr
- 62 Pendleton Dr
- 56 Pendleton Dr
- 127 Pine Haven Rd
- 54 Pendleton Dr
- 11 Empire Ln
- 52 Pendleton Dr
- 26 Pendleton Dr
- 47 Pendleton Dr
- 64 Pendleton Dr
- 45 Pendleton Dr
- 48 Pendleton Dr
- 2 Empire Ln
- 69 Pendleton Dr
- 25 Rose Ln
- 74 Pendleton Dr
- 24 Empire Ln
- 43 Pendleton Dr
- 27 Empire Ln
- 76 Pendleton Dr
Your Personal Tour Guide
Ask me questions while you tour the home.