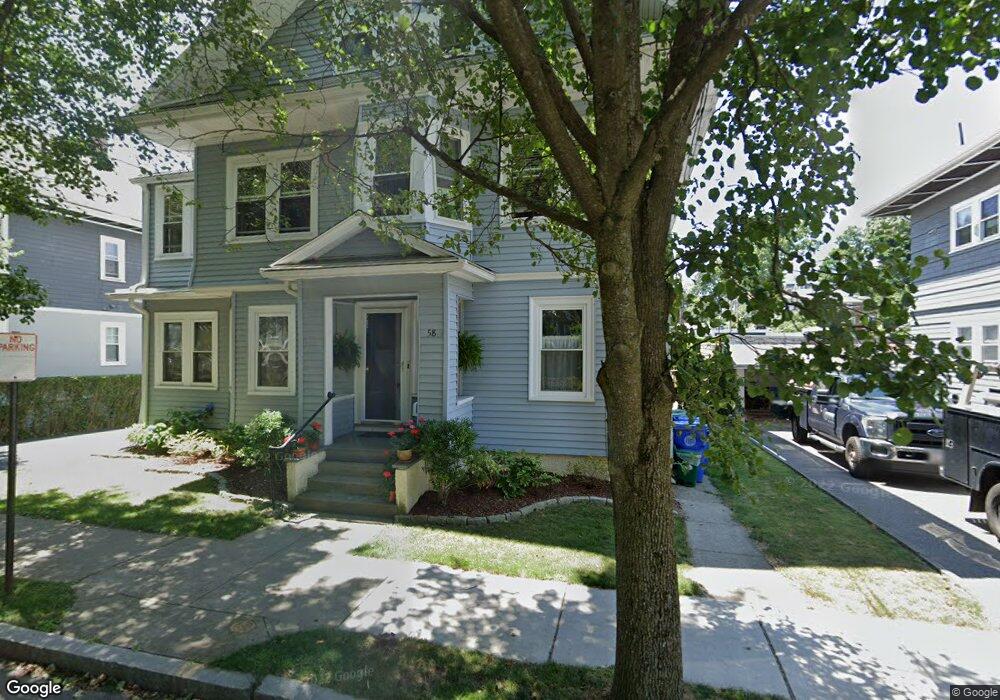
58 Playstead Rd Newton, MA 02458
Newton Corner NeighborhoodEstimated Value: $1,293,000 - $1,462,000
6
Beds
3
Baths
2,810
Sq Ft
$486/Sq Ft
Est. Value
About This Home
This home is located at 58 Playstead Rd, Newton, MA 02458 and is currently estimated at $1,366,429, approximately $486 per square foot. 58 Playstead Rd is a home located in Middlesex County with nearby schools including Underwood Elementary School, Bigelow Middle School, and Newton North High School.
Ownership History
Date
Name
Owned For
Owner Type
Purchase Details
Closed on
Feb 18, 2026
Sold by
Steele Maria A and Neumann Peter A
Bought by
Peter A Neumann T A and Peter Neumann
Current Estimated Value
Purchase Details
Closed on
Apr 18, 2007
Sold by
Steele Maria A
Bought by
Steele Maria A and Neumann Peter A
Home Financials for this Owner
Home Financials are based on the most recent Mortgage that was taken out on this home.
Original Mortgage
$150,000
Interest Rate
6.19%
Mortgage Type
Purchase Money Mortgage
Create a Home Valuation Report for This Property
The Home Valuation Report is an in-depth analysis detailing your home's value as well as a comparison with similar homes in the area
Home Values in the Area
Average Home Value in this Area
Purchase History
| Date | Buyer | Sale Price | Title Company |
|---|---|---|---|
| Peter A Neumann T A | -- | -- | |
| Steele Maria A | -- | -- |
Source: Public Records
Mortgage History
| Date | Status | Borrower | Loan Amount |
|---|---|---|---|
| Previous Owner | Steele Maria A | $150,000 |
Source: Public Records
Tax History
| Year | Tax Paid | Tax Assessment Tax Assessment Total Assessment is a certain percentage of the fair market value that is determined by local assessors to be the total taxable value of land and additions on the property. | Land | Improvement |
|---|---|---|---|---|
| 2025 | $11,593 | $1,183,000 | $805,600 | $377,400 |
| 2024 | $11,209 | $1,148,500 | $782,100 | $366,400 |
| 2023 | $10,504 | $1,031,800 | $621,000 | $410,800 |
| 2022 | $10,051 | $955,400 | $575,000 | $380,400 |
| 2021 | $9,431 | $876,500 | $527,500 | $349,000 |
| 2020 | $9,151 | $876,500 | $527,500 | $349,000 |
| 2019 | $8,561 | $819,200 | $493,000 | $326,200 |
| 2018 | $8,540 | $789,300 | $465,000 | $324,300 |
| 2017 | $8,052 | $724,100 | $426,600 | $297,500 |
| 2016 | $7,560 | $664,300 | $391,400 | $272,900 |
| 2015 | $6,859 | $590,800 | $365,800 | $225,000 |
Source: Public Records
Map
Nearby Homes
- 70 Washington St
- 70 Washington St Unit 70
- 143 Tremont St Unit A
- 143 Tremont St Unit 2
- 99 Tremont St Unit 206
- 99 Tremont St Unit 105
- 99 Tremont St Unit 513
- 180 Hunnewell Ave Unit 180
- 180 Hunnewell Ave Unit A
- 159 Washington St Unit 4
- 68 Vernon St
- 65-67 Saint James Cir
- 269 Franklin St
- 4 Remick Terrace
- 96 Brayton Rd
- 61 Huntington Rd
- 144 Newton St Unit 1
- 48 Nonantum St
- 97 Eldredge St
- 9 Baldwin St Unit 15C
- 54 Playstead Rd Unit 2
- 54 Playstead Rd
- 52 Playstead Rd
- 52 Playstead Rd Unit 52
- 62 Playstead Rd
- 62 Playstead Rd Unit 1
- 62 Playstead Rd Unit 2
- 197 Tremont St
- 193 Tremont St
- 59 Playstead Rd
- 63 Playstead Rd
- 55 Playstead Rd
- 50 Playstead Rd Unit 2
- 50 Playstead Rd Unit 1
- 50 Playstead Rd Unit 2-50
- 50 Playstead Rd Unit 1-50
- 189 Tremont St Unit 2
- 189 Tremont St Unit 1
- 47 Playstead Rd
- 209 Tremont St Unit 211
Your Personal Tour Guide
Ask me questions while you tour the home.