Estimated Value: $338,092 - $375,000
3
Beds
2
Baths
1,432
Sq Ft
$250/Sq Ft
Est. Value
About This Home
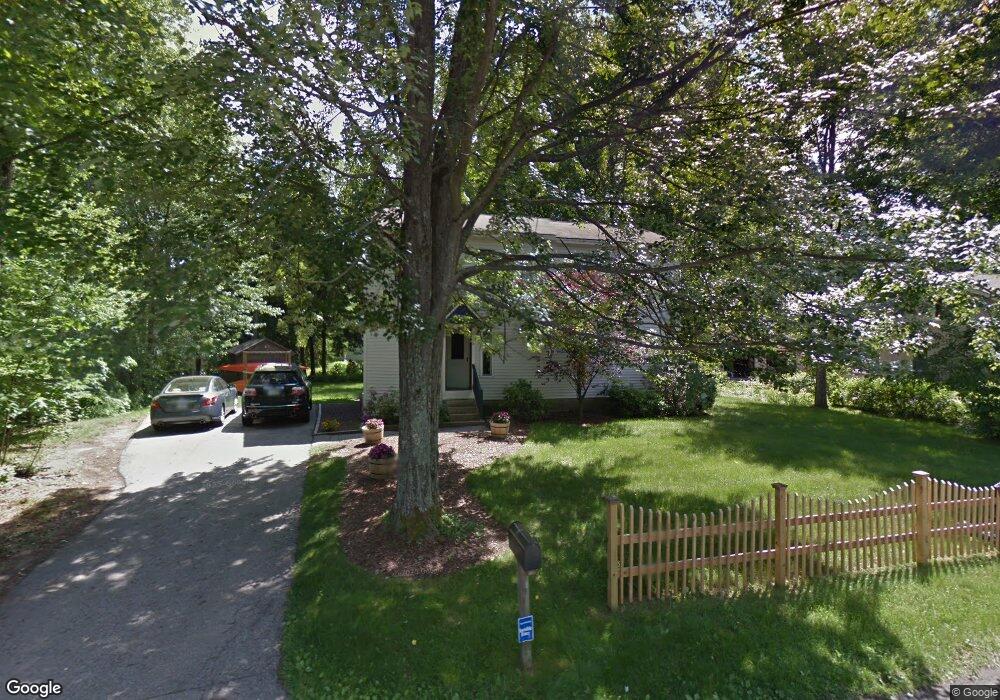
This home is located at 58 Robbins Rd, Keene, NH 03431 and is currently estimated at $358,023, approximately $250 per square foot. 58 Robbins Rd is a home with nearby schools including Symonds Elementary School, Keene High School, and Gathering Waters Charter School (H).
Ownership History
Date
Name
Owned For
Owner Type
Purchase Details
Closed on
Oct 3, 2000
Sold by
Mullens Jo Beth
Bought by
Newell Daniel and Newell Caitlin M
Current Estimated Value
Home Financials for this Owner
Home Financials are based on the most recent Mortgage that was taken out on this home.
Original Mortgage
$109,944
Outstanding Balance
$40,153
Interest Rate
7.94%
Estimated Equity
$317,870
Purchase Details
Closed on
Jun 18, 1996
Sold by
Hanscome Phillip L and Hanscome Judy R
Bought by
Mullens Jo Beth
Home Financials for this Owner
Home Financials are based on the most recent Mortgage that was taken out on this home.
Original Mortgage
$69,300
Interest Rate
7.97%
Create a Home Valuation Report for This Property
The Home Valuation Report is an in-depth analysis detailing your home's value as well as a comparison with similar homes in the area
Purchase History
| Date | Buyer | Sale Price | Title Company |
|---|---|---|---|
| Newell Daniel | $110,000 | -- | |
| Mullens Jo Beth | $77,000 | -- |
Source: Public Records
Mortgage History
| Date | Status | Borrower | Loan Amount |
|---|---|---|---|
| Open | Mullens Jo Beth | $109,944 | |
| Previous Owner | Mullens Jo Beth | $69,300 |
Source: Public Records
Tax History
| Year | Tax Paid | Tax Assessment Tax Assessment Total Assessment is a certain percentage of the fair market value that is determined by local assessors to be the total taxable value of land and additions on the property. | Land | Improvement |
|---|---|---|---|---|
| 2024 | $6,766 | $204,600 | $57,900 | $146,700 |
| 2023 | $6,525 | $204,600 | $57,900 | $146,700 |
| 2022 | $6,349 | $204,600 | $57,900 | $146,700 |
| 2021 | $6,400 | $204,600 | $57,900 | $146,700 |
| 2020 | $6,367 | $170,800 | $67,800 | $103,000 |
| 2019 | $6,366 | $169,300 | $67,800 | $101,500 |
| 2018 | $6,284 | $169,300 | $67,800 | $101,500 |
| 2017 | $6,301 | $169,300 | $67,800 | $101,500 |
| 2016 | $6,161 | $169,300 | $67,800 | $101,500 |
Source: Public Records
Map
Nearby Homes
Your Personal Tour Guide
Ask me questions while you tour the home.