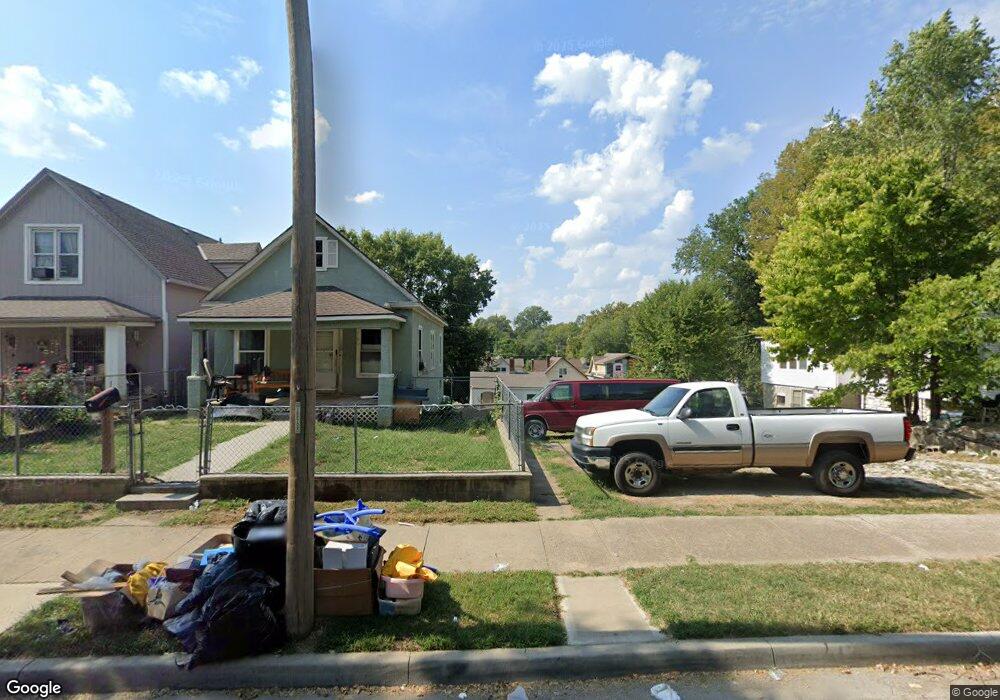
58 S 11th St Kansas City, KS 66102
Riverview NeighborhoodEstimated Value: $94,159 - $182,000
1
Bed
1
Bath
480
Sq Ft
$285/Sq Ft
Est. Value
About This Home
This home is located at 58 S 11th St, Kansas City, KS 66102 and is currently estimated at $136,790, approximately $284 per square foot. 58 S 11th St is a home located in Wyandotte County with nearby schools including Whittier Elementary, Central Middle School, and Wyandotte High School.
Ownership History
Date
Name
Owned For
Owner Type
Purchase Details
Closed on
Aug 13, 2021
Sold by
Canas Leticia Prieto and Canas Gregorio
Bought by
Cortes Miguel Martinez and Morales Montero Sara
Current Estimated Value
Purchase Details
Closed on
Oct 26, 2018
Sold by
Leticia Prieto
Bought by
Cortes Miguel Martinez and Montero Sara Morales
Home Financials for this Owner
Home Financials are based on the most recent Mortgage that was taken out on this home.
Original Mortgage
$7,000
Interest Rate
4.6%
Mortgage Type
Land Contract Argmt. Of Sale
Purchase Details
Closed on
Oct 2, 2018
Sold by
Prieto Eeticia
Bought by
Martinez Cortes Miguel and Morales Montero Sara
Home Financials for this Owner
Home Financials are based on the most recent Mortgage that was taken out on this home.
Original Mortgage
$7,000
Interest Rate
4.6%
Mortgage Type
Land Contract Argmt. Of Sale
Create a Home Valuation Report for This Property
The Home Valuation Report is an in-depth analysis detailing your home's value as well as a comparison with similar homes in the area
Home Values in the Area
Average Home Value in this Area
Purchase History
| Date | Buyer | Sale Price | Title Company |
|---|---|---|---|
| Cortes Miguel Martinez | -- | None Available | |
| Cortes Miguel Martinez | $25,000 | -- | |
| Martinez Cortes Miguel | $25,000 | None Available |
Source: Public Records
Mortgage History
| Date | Status | Borrower | Loan Amount |
|---|---|---|---|
| Previous Owner | Martinez Cortes Miguel | $7,000 |
Source: Public Records
Tax History Compared to Growth
Tax History
| Year | Tax Paid | Tax Assessment Tax Assessment Total Assessment is a certain percentage of the fair market value that is determined by local assessors to be the total taxable value of land and additions on the property. | Land | Improvement |
|---|---|---|---|---|
| 2024 | $859 | $6,348 | $1,873 | $4,475 |
| 2023 | $686 | $4,750 | $1,793 | $2,957 |
| 2022 | $606 | $4,163 | $476 | $3,687 |
| 2021 | $331 | $2,241 | $369 | $1,872 |
| 2020 | $285 | $1,932 | $290 | $1,642 |
| 2019 | $230 | $1,558 | $309 | $1,249 |
| 2018 | $206 | $1,404 | $215 | $1,189 |
| 2017 | $189 | $1,276 | $215 | $1,061 |
| 2016 | $208 | $1,389 | $215 | $1,174 |
| 2015 | $211 | $1,389 | $215 | $1,174 |
| 2014 | $124 | $728 | $215 | $513 |
Source: Public Records
Map
Nearby Homes